Statistics in Action
Practical Applications for Real-World Decision Making
Make smarter decisions backed by data.
222 pages10 chaptersNov 6, 2025Statistics
About this book
This practical guide teaches you how to apply statistical methods to real-world problems, whether you're analyzing business metrics, evaluating research claims, or understanding trends in your field. You'll move beyond theoretical concepts to master the tools that professionals use daily: descriptive statistics, probability, hypothesis testing, and regression analysis. Learn how to collect reliable data, avoid common statistical pitfalls, and communicate your findings with confidence. Each chapter includes practical examples and step-by-step guidance so you can immediately apply what you learn. Whether you're optimizing business processes, conducting research, or simply making better-informed choices, this book equips you with the statistical literacy needed to interpret data critically and act decisively in an increasingly data-driven world.
Table of contents
- IntroductionWhy Statistics Matters in Today's World, How to Use This Book, What You'll Learn and How to Apply ItRead below
- Chapter 1: Foundations of Statistical ThinkingUnderstanding Data Types and Variables, Populations, Samples, and Why It Matters, Developing a Statistical Mindset
- Chapter 2: Descriptive Statistics: Summarizing Your DataMeasures of Central Tendency: Mean, Median, Mode, Measures of Spread: Variance and Standard Deviation, Visualizing Data: Charts, Graphs, and Distributions, Summarizing Data Effectively for Different Audiences
- Chapter 3: Probability: Understanding UncertaintyProbability Fundamentals and Rules, Common Probability Distributions, Expected Value and Decision Making, Using Probability for Risk Assessment
- Chapter 4: Sampling Methods: Building Reliable DataSampling Strategies and Techniques, Determining Appropriate Sample Size, Recognizing and Avoiding Sampling Bias
- Chapter 5: Hypothesis Testing: Validating ClaimsThe Hypothesis Testing Framework, Understanding P-Values and Statistical Significance, Common Hypothesis Tests and When to Use Them, Interpreting Results and Avoiding Misinterpretation
- Chapter 6: Correlation and Regression: Finding RelationshipsCorrelation: Measuring Relationships Between Variables, The Critical Distinction: Correlation vs. Causation, Linear Regression: Predicting and Explaining, Practical Applications of Regression Analysis
- Chapter 7: Statistical Pitfalls and How to Avoid ThemCommon Statistical Errors and Misconceptions, P-Hacking, Selection Bias, and Data Dredging, Confounding Variables and Hidden Relationships, Quality Control: Ensuring Data Integrity
- Chapter 8: Communicating Statistical FindingsCreating Effective Visualizations for Impact, Writing Clear Statistical Reports, Presenting Data to Different Audiences
- Chapter 9: Real-World Applications Across IndustriesBusiness Analytics and Performance Metrics, Healthcare and Medical Research Applications, Social Science and Survey Research, Quality Improvement and Process Optimization
- Chapter 10: Ethics and Responsibility in StatisticsEthical Principles in Data Analysis, Data Privacy and Confidentiality, Responsible Reporting and Transparency
- ConclusionKey Takeaways and Next Steps, Continuing Your Statistical Journey
- Glossary of Statistical Terms
- Further Reading and Resources
Introduction
Every day, you make decisions based on data. You check weather forecasts before planning outdoor activities. You compare product reviews before making purchases. You evaluate job offers by weighing salary, benefits, and growth potential. Whether you realize it or not, you're already thinking statistically. The difference between casual data observation and true statistical literacy lies in your ability to systematically analyze information, understand uncertainty, and make evidence-based decisions with confidence. This book bridges that gap by transforming foundational statistical knowledge into practical skills you can apply immediately in your professional and personal life.
Statistics has evolved from an academic discipline into an essential language of modern decision-making. Organizations across every industry rely on statistical analysis to optimize operations, understand customer behavior, and predict future trends. Researchers use statistical methods to validate discoveries and advance human knowledge. Policymakers depend on statistical evidence to craft effective legislation. Even in everyday contexts, statistical literacy helps you evaluate news claims, understand medical test results, and make informed financial choices. The ability to work with data isn't just valuable for data scientists or researchers anymore. It's become a core competency for anyone who wants to navigate an increasingly complex, information-rich world effectively.
This book assumes you already have foundational knowledge of basic statistical concepts. You've encountered terms like mean, standard deviation, and probability. You understand that statistics involves collecting and analyzing data. Now you're ready to move beyond definitions and formulas to tackle the practical question: how do I actually use these tools to solve real problems? The chapters ahead focus on application rather than theory, providing step-by-step guidance for implementing statistical methods in contexts that matter to you. You'll learn not just what statistical techniques exist, but when to use them, how to execute them correctly, and how to interpret results in ways that drive meaningful action.
The approach throughout this book emphasizes clarity and practicality. Complex statistical concepts are broken down into manageable components with concrete examples drawn from business, research, healthcare, and everyday decision-making. Each chapter builds on previous material while standing alone as a reference for specific techniques. You'll find frameworks for approaching common analytical challenges, warnings about pitfalls that trap even experienced analysts, and guidance for communicating your findings to audiences with varying levels of statistical knowledge. The goal isn't to make you a theoretical statistician, but to equip you with the practical skills and critical thinking abilities needed to work confidently with data in real-world situations.
Why Statistics Matters in Today's World
The volume of data generated globally has exploded exponentially over the past decade. Every digital interaction, transaction, sensor reading, and social media post contributes to an ever-growing ocean of information. Organizations that can effectively analyze this data gain competitive advantages, while those that cannot risk making decisions based on intuition alone in environments where evidence-based approaches consistently outperform gut feelings. Statistical literacy has transformed from a specialized skill into a fundamental requirement for professional effectiveness across virtually every field. Understanding statistics means understanding how to extract signal from noise, how to quantify uncertainty, and how to make decisions that are defensible, repeatable, and grounded in evidence rather than assumption.
Consider the practical impact of statistical thinking in business contexts. A marketing manager who understands hypothesis testing can design experiments to determine which advertising campaign actually drives sales rather than simply correlating spending with revenue. A product manager who grasps regression analysis can identify which features most strongly predict customer satisfaction and prioritize development accordingly. An operations director who applies statistical process control can distinguish between normal variation and genuine problems requiring intervention, avoiding both overreaction to random fluctuations and underreaction to systematic issues. These applications don't require advanced mathematics or specialized software expertise. They require understanding which statistical tools address which questions and how to apply them systematically to real business challenges.
Healthcare and medical research provide equally compelling examples of statistics in action. Clinical trials rely on rigorous statistical design to determine whether new treatments actually work better than existing options or placebos. Diagnostic tests are evaluated using statistical measures of sensitivity and specificity that determine how reliably they identify disease. Epidemiologists use statistical methods to track disease outbreaks, identify risk factors, and evaluate intervention effectiveness. Even individual medical decisions benefit from statistical thinking. When a doctor says a treatment has a seventy percent success rate, statistical literacy helps you understand what that means for your specific situation, what questions to ask about how that rate was calculated, and how to weigh that information against potential risks and alternatives.
The rise of misinformation and misleading data presentations makes statistical literacy increasingly important for informed citizenship. News articles frequently cite statistics to support claims, but those statistics may be based on flawed methodologies, cherry-picked data, or misinterpreted results. Political campaigns use polling data selectively to create narratives that may not reflect actual public opinion. Advocacy groups present correlations as if they prove causation to advance particular agendas. Without statistical literacy, you're vulnerable to manipulation by anyone who can dress up weak evidence in the language of data and analysis. With statistical literacy, you can evaluate claims critically, ask probing questions about methodology, and distinguish between genuine insights and statistical sleight of hand.
Statistics also matters because it provides a framework for thinking clearly about uncertainty. Life is inherently uncertain, yet humans tend to be poor intuitive judges of probability and risk. We overestimate the likelihood of dramatic but rare events while underestimating common risks. We see patterns in random noise and mistake coincidence for causation. We anchor too heavily on initial information and fail to update our beliefs appropriately when new evidence emerges. Statistical thinking provides systematic methods for quantifying uncertainty, updating beliefs based on evidence, and making decisions that account for risk in rational ways. These skills apply far beyond formal data analysis, improving judgment in contexts from financial planning to career decisions to everyday risk assessment.
The democratization of data analysis tools has made statistical methods more accessible than ever before. Software that once required specialized training and expensive licenses is now available as free, user-friendly applications. Cloud computing platforms provide powerful analytical capabilities without requiring infrastructure investment. Online courses and resources make statistical education available to anyone with internet access. This accessibility creates both opportunity and responsibility. The opportunity lies in your ability to leverage these tools to answer questions and solve problems that would have required hiring specialists in the past. The responsibility lies in using these tools correctly, understanding their limitations, and avoiding the pitfalls that come from applying sophisticated techniques without adequate understanding of underlying principles.
Perhaps most importantly, statistics matters because it changes how you think about evidence and truth. Statistical thinking acknowledges that perfect certainty is rarely achievable and that all conclusions come with some degree of uncertainty. It emphasizes the importance of systematic observation over anecdote, replication over single studies, and transparency over hidden assumptions. It recognizes that data can be misleading and that analytical choices matter enormously for conclusions. This mindset of healthy skepticism combined with evidence-based reasoning serves you well far beyond formal statistical analysis. It makes you a more critical consumer of information, a more effective problem-solver, and a more thoughtful decision-maker in all aspects of life where evidence and uncertainty intersect.
How to Use This Book
This book is designed as both a learning resource and a practical reference. If you're reading it for the first time, working through chapters sequentially provides the most coherent learning experience, as later chapters build on concepts and techniques introduced earlier. Each chapter focuses on a specific aspect of applied statistics, moving from foundational concepts through descriptive statistics, probability, sampling, hypothesis testing, regression analysis, common pitfalls, communication strategies, real-world applications, and ethical considerations. This progression mirrors the typical workflow of statistical analysis: understanding your data, applying appropriate analytical techniques, avoiding common errors, and communicating findings effectively.
However, the book is also structured to support selective reading based on your immediate needs. If you're facing a specific analytical challenge, you can jump directly to the relevant chapter. Need to design a survey? Start with the sampling methods chapter. Trying to determine whether a business intervention actually worked? Go straight to hypothesis testing. Each chapter includes sufficient context to stand alone while providing references to related material elsewhere in the book. This flexibility recognizes that your learning needs may be driven by practical problems requiring immediate solutions rather than purely sequential skill development.
Throughout the book, you'll encounter several types of content designed to support different learning styles and applications:
- Conceptual explanations that clarify what statistical techniques do and why they matter
- Step-by-step procedures that walk you through implementing specific methods
- Concrete examples drawn from business, research, healthcare, and everyday contexts
- Common pitfalls that highlight mistakes to avoid and how to recognize them
- Practical frameworks that provide structured approaches to common analytical challenges
- Communication guidance that helps you present findings to different audiences effectively
The examples throughout the book are deliberately diverse, spanning multiple industries and contexts. This diversity serves two purposes. First, it demonstrates that statistical methods are genuinely universal tools applicable across vastly different domains. The same hypothesis testing framework that helps a pharmaceutical company evaluate a new drug also helps a retailer assess whether a store redesign increased sales. Second, exposure to varied examples helps you develop the pattern recognition skills needed to identify which statistical approaches fit which situations. You'll begin to recognize structural similarities between seemingly different problems and transfer solutions from familiar contexts to new challenges.
As you work through the material, actively engage with the concepts rather than passively reading. When you encounter an example, pause to consider how you might apply similar thinking to problems in your own work or life. When a chapter presents a framework or procedure, think about a specific dataset or question you could apply it to. If possible, work through examples with actual data relevant to your interests. Statistical literacy develops through practice and application, not just reading. The more actively you engage with the material, connecting it to your own experiences and challenges, the more effectively you'll internalize the concepts and develop genuine analytical capability.
The book deliberately avoids heavy mathematical notation and proofs in favor of conceptual understanding and practical application. This doesn't mean the content is mathematically imprecise or oversimplified. Rather, it reflects a focus on helping you understand what statistical methods do, when to use them, and how to interpret results correctly. You don't need to derive formulas from first principles to apply statistical techniques effectively, just as you don't need to understand internal combustion engine thermodynamics to drive a car competently. Where mathematical concepts are essential for proper application, they're explained in accessible terms with emphasis on intuition and practical implications rather than formal proofs.
Pay particular attention to the sections on common pitfalls and misinterpretations. Statistics is powerful precisely because it can reveal patterns and relationships that aren't obvious from casual observation. However, this power comes with responsibility. Statistical methods can be misapplied, either through honest error or deliberate manipulation, leading to conclusions that are misleading or outright wrong. Understanding what can go wrong is just as important as understanding how to perform analyses correctly. The pitfalls sections aren't meant to discourage you from using statistical methods but to help you apply them more carefully and interpret others' statistical claims more critically.
Finally, recognize that this book is a beginning, not an ending. Statistics is a vast field with specialized techniques for countless specific applications. This book focuses on core methods that provide the foundation for most practical statistical work and that transfer across diverse contexts. As you develop confidence with these fundamentals, you'll be well-positioned to explore more advanced techniques relevant to your specific interests and needs. The further reading section at the end of the book provides guidance for continued learning, pointing you toward resources for deepening your understanding of topics introduced here and exploring specialized applications in particular domains.
What You'll Learn and How to Apply It
The first major skill you'll develop is the ability to properly describe and summarize data. Descriptive statistics might sound basic, but it's the foundation of all statistical analysis and the most frequently used statistical skill in practical work. You'll learn how to calculate and interpret measures of central tendency like means and medians, understanding when each is appropriate and what they reveal about your data. You'll master measures of spread like standard deviation and variance, which quantify how much variability exists in your data. You'll develop skill in creating effective visualizations that reveal patterns and communicate findings clearly. These descriptive techniques apply immediately to countless situations: summarizing sales performance, characterizing customer demographics, tracking project metrics, or presenting research findings.
Building on descriptive statistics, you'll develop a working understanding of probability and how it applies to real-world decision-making. Probability provides the mathematical foundation for quantifying uncertainty and risk. You'll learn to calculate probabilities for various scenarios, understand common probability distributions and what they represent, and use expected value calculations to compare alternatives with uncertain outcomes. These skills have direct applications in risk assessment, quality control, financial planning, and any situation where you need to make decisions under uncertainty. For example, understanding probability helps you evaluate whether insurance is worth the cost, assess the reliability of manufacturing processes, or determine appropriate inventory levels given uncertain demand.
Sampling methodology represents another critical skill set you'll acquire. Most statistical analysis involves working with samples rather than complete populations, making sampling design crucial for reliable conclusions. You'll learn different sampling strategies and when each is appropriate, how to determine adequate sample sizes for your purposes, and how to recognize and avoid sampling bias that can invalidate your findings. These skills matter whenever you're collecting data: designing customer surveys, conducting market research, performing quality inspections, or selecting participants for studies. Poor sampling can render even sophisticated analysis worthless, while good sampling enables reliable conclusions from manageable data collection efforts.
Hypothesis testing provides a structured framework for validating claims and making evidence-based decisions. You'll learn how to formulate null and alternative hypotheses, select appropriate statistical tests for different situations, calculate and interpret p-values correctly, and draw valid conclusions while avoiding common misinterpretations. Hypothesis testing applies to questions like: Did this marketing campaign actually increase sales? Is this new manufacturing process producing fewer defects? Do customers prefer product A over product B? The framework helps you distinguish genuine effects from random variation and quantify your confidence in conclusions. You'll also learn about the limitations of hypothesis testing and situations where alternative approaches are more appropriate.
Correlation and regression analysis enable you to identify and quantify relationships between variables. You'll learn to calculate correlation coefficients and understand what they reveal about relationships, critically distinguish between correlation and causation to avoid false conclusions, build and interpret linear regression models, and use regression for both explanation and prediction. These techniques apply to questions like: What factors most strongly predict customer satisfaction? How does advertising spending relate to sales revenue? Can we predict equipment failure based on operating conditions? Regression analysis is among the most widely used statistical techniques in business and research, making it an essential skill for anyone working with data regularly.
Understanding common statistical pitfalls and how to avoid them is just as important as learning analytical techniques. You'll develop awareness of errors like:
- Confusing correlation with causation, leading to incorrect conclusions about cause-and-effect relationships
- Selection bias, where non-representative samples produce misleading results
- P-hacking, where analysts manipulate data or tests to achieve desired significance levels
- Ignoring confounding variables that create spurious relationships between variables of interest
- Overfitting models that perform well on sample data but fail to generalize
- Misinterpreting p-values as probability that hypotheses are true
Communication skills represent the final essential component of applied statistics. Analysis has no value if you can't effectively communicate findings to stakeholders who need to act on them. You'll learn to create visualizations that clearly convey key insights without misleading or overwhelming audiences, write statistical reports that are both rigorous and accessible, and present findings to audiences with varying levels of statistical knowledge. You'll develop the ability to translate statistical results into actionable recommendations and to explain complex analyses in terms that non-technical stakeholders can understand and use. These communication skills often determine whether your analytical work actually influences decisions and creates value.
Throughout your learning journey, you'll develop what might be called statistical intuition: the ability to look at a problem and recognize which analytical approaches are appropriate, to examine data and spot potential issues or interesting patterns, to evaluate statistical claims critically and ask probing questions about methodology. This intuition develops gradually through exposure to diverse examples and active practice. It's what enables experienced analysts to quickly identify promising analytical directions and avoid dead ends. While this book can't provide years of experience, it can accelerate your development of statistical intuition by exposing you to varied applications and highlighting the reasoning processes that guide analytical decisions.
The ultimate goal is to make you a more effective decision-maker. Statistics isn't an end in itself but a means to better understanding, more reliable conclusions, and more informed choices. Every technique and concept in this book serves that practical purpose. As you progress through the chapters, continually connect the material back to decisions you face in your work and life. Ask yourself: How could this technique help me answer questions I care about? What decisions could I make more confidently with this analytical approach? How would this change how I evaluate claims or assess evidence? This practical orientation ensures that your statistical learning translates into genuine capability for solving real problems and making better decisions in contexts that matter to you.
This is the end of the free sample. The full book has 10 chapters.
Want this book written for you?
Tell us your goals and background, and get your own version of this book, tailored by AI to you.


Benefits of AI-tailored books
- Read one book, not ten:
- all the Statistics knowledge you need, gathered into a single book.
- Save days of learning:
- tell us your goals, choose your topics, and the whole book is built around them.
- Learn effortlessly:
- Statistics book written for your specific background and expertise.
- Understand at a glance:
- includes charts, tables, timelines, checklists, decision trees, and more.
- Stay current:
- written the day you order it, not years ago.
- Trust what you read:
- every book is checked for accuracy, with real research when your subject needs it.
Create your unique book in 3 steps
- 1. Select your focus
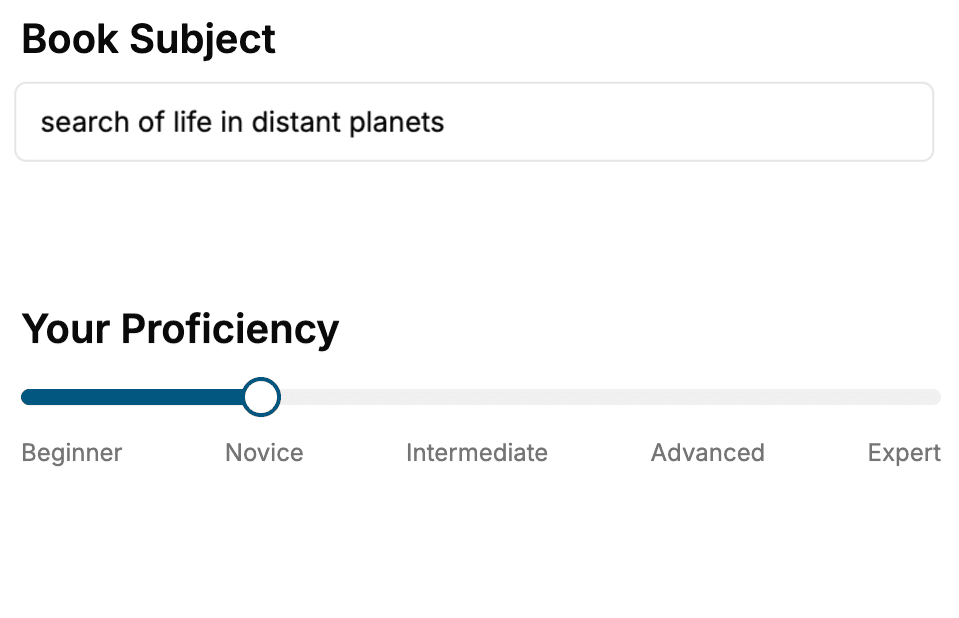
Select the focus of your Statistics book and share your background
- 2. Personalize your book
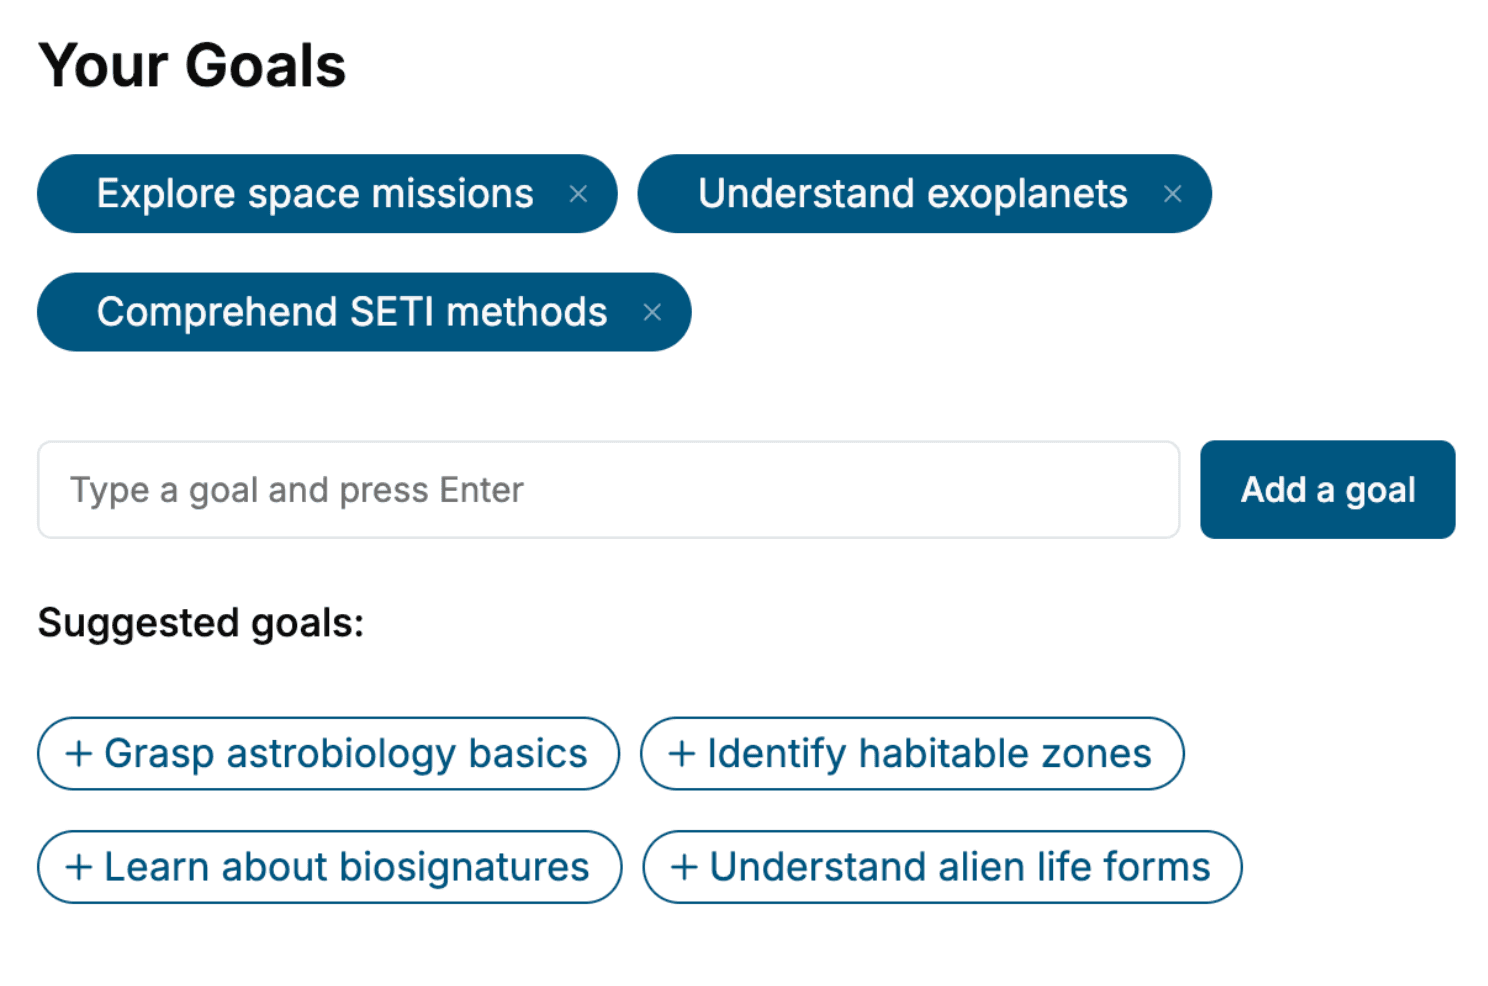
Specify your goals and choose sub-topics to include
- 3. Get your tailored book
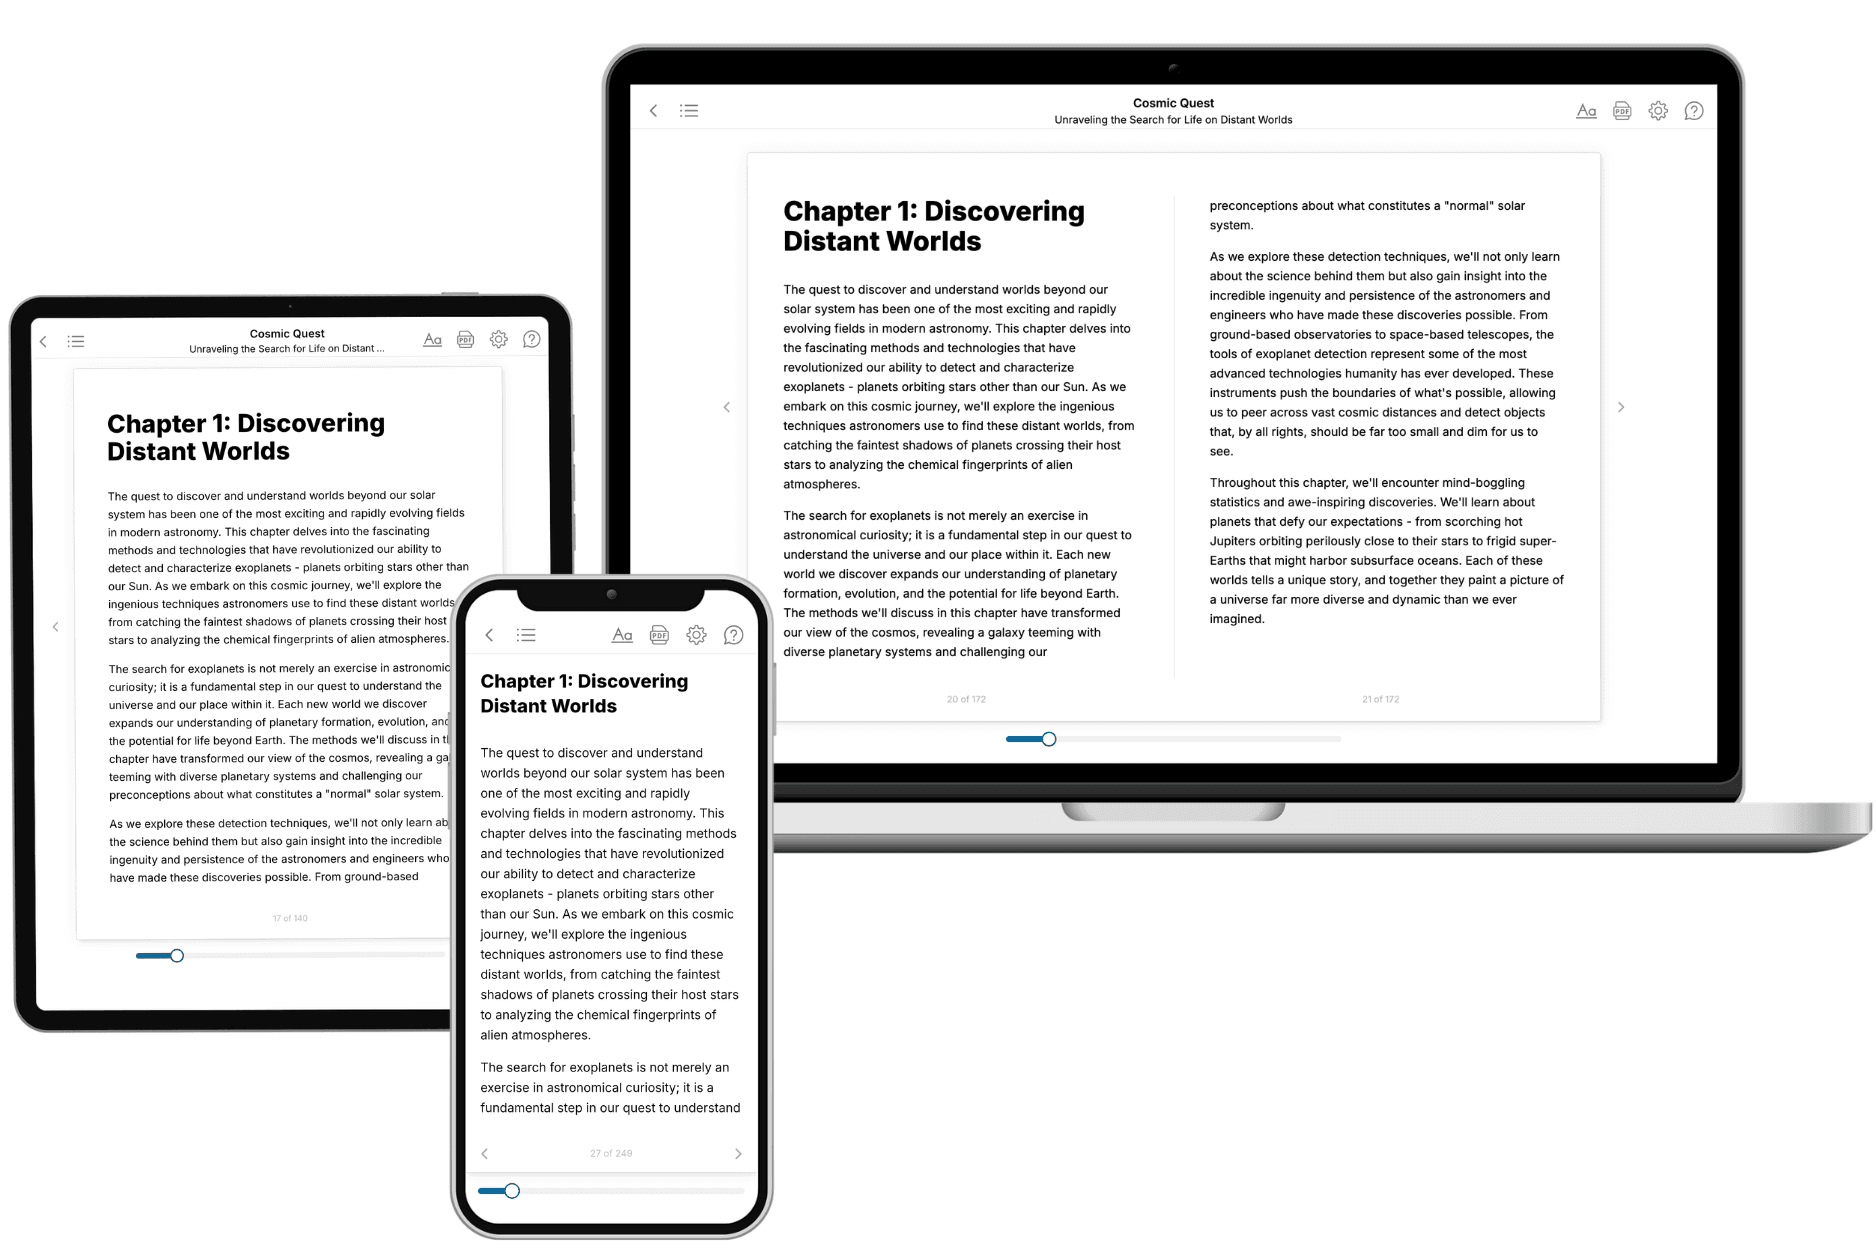
Your book is ready in 10 minutes. Read it online, download as EPUB or PDF, or send to Kindle.
Frequently asked questions
- What is TailoredRead?
TailoredRead creates complete, full-length nonfiction ebooks, written specifically for you. Tell us what you want to learn and why, and TailoredRead writes you a complete ebook on it, with charts, tables, and diagrams throughout. Read it online, on Kindle, or on any e-reader, or download it as a PDF or EPUB. Every book is written fresh the day you order it.
- How is the book tailored to me?
Before anything is written, you answer a few short questions about your goals, your background, and the topics you care about. Your book is then planned around your answers: written at your level, focused on your goals, and covering the topics you chose, instead of the one-size-fits-all book a store sells everyone.
- Will it read like generic AI content?
No. Your book isn't a chat transcript: it's planned chapter by chapter before a single word is written, told in a clear book voice, and explains ideas visually with charts, tables, and diagrams. After writing, every book goes through an editorial pass that polishes chapters so the book reads consistent from start to finish. Judge for yourself: browse thousands of sample books on our Explore Books page.
- How accurate is the content?
Our AI first checks whether your subject needs live research. Niche and fast-moving subjects are researched before writing, and the book plan and chapters are grounded in what it finds. After writing, every book goes through a quality pass that checks its facts and consistency, and researched books list their sources in a Notes section at the back.
- How long is the book?
You choose the length: Comprehensive (250-300 pages), Detailed (150-200 pages), Essential (70-100 pages), or Short (30-50 pages).
- Does the book include visuals?
Yes. Every book includes charts, tables, and diagrams: timelines, checklists, step-by-step guides, decision trees, comparison tables, matrices, and bar charts. A typical book includes dozens of these visual elements.
- Can I read it on Kindle? What formats can I download?
Yes. Every book can be read in our online reader or downloaded as a PDF or EPUB. The EPUB can be opened with Kindle, Apple Books, Kobo, and any e-reader. The Commercial and Author licenses also include an editable Word (DOCX) and Markdown download.
- How much does it cost?
About the price of a regular ebook. The exact price depends on your book's length and complexity, from $2 for the shortest books to $35 for the most comprehensive, and it's shown when you review your book, before you commit to anything. Each book is a one-time purchase, yours to keep, no subscription. Licenses that let you share, teach, or publish your book range from $35.99 to $49.99.
- Can I preview the book before purchasing?
Before you pay, you'll see what your book will cover: the title, a detailed description, the estimated length, and the complete chapter-by-chapter table of contents, so you know what you're getting before you decide. The full text itself is written after you purchase.
- How long does it take to create a book?
About 10 minutes. You can start reading the opening chapters while the rest is still being written.