Survival Modeling Essentials
Master the Statistics and Mathematics of Time-to-Event Analysis
Master the essential concepts and techniques of survival modeling to analyze time-to-event data with confidence.
222 pages10 chaptersMar 3, 2026Statistics
About this book
This comprehensive guide takes you from foundational principles through advanced applications, providing the mathematical rigor and practical insights you need to apply survival analysis in real-world research and data science projects. You'll learn how to handle censored data, estimate survival probabilities, build predictive models, and interpret results correctly. Whether you're working in healthcare, engineering, finance, or social sciences, this book equips you with the statistical tools and conceptual understanding to tackle complex survival analysis challenges. Each chapter combines theoretical foundations with practical examples, diagnostic techniques, and implementation guidance to ensure you can immediately apply these methods to your own data.
Table of contents
- IntroductionWhy Survival Analysis Matters, Applications Across Industries and Disciplines, What You'll Learn in This Book, How to Use This GuideRead below
- Chapter 1: Fundamentals of Survival AnalysisDefining Survival Data and Time-to-Event Concepts, Understanding Censoring: Types and Implications, The Survival Function and Hazard Function, Key Probability Distributions in Survival Analysis
- Chapter 2: Non-Parametric Methods: Kaplan-Meier EstimationThe Kaplan-Meier Estimator: Principles and Calculation, Computing Confidence Intervals and Standard Errors, Interpreting and Visualizing Survival Curves, Limitations and Assumptions of Kaplan-Meier
- Chapter 3: Comparing Survival Curves: Statistical TestsThe Log-Rank Test and Its Variants, The Wilcoxon Test for Survival Comparison, Multiple Comparisons and Adjustment Methods, Interpreting Test Results and Effect Sizes
- Chapter 4: Semi-Parametric Regression: Cox Proportional HazardsThe Cox Model: Foundations and Assumptions, The Proportional Hazards Assumption, Partial Likelihood and Model Estimation, Interpreting Hazard Ratios and Coefficients
- Chapter 5: Parametric Survival ModelsThe Exponential Model: Constant Hazard, The Weibull Model: Flexible Hazard Shapes, The Lognormal and Other Parametric Distributions, Selecting and Comparing Parametric Models
- Chapter 6: Model Diagnostics and Assumption CheckingResidual Analysis and Goodness-of-Fit, Testing the Proportional Hazards Assumption, Identifying Influential Observations and Outliers, Cross-Validation and External Validation
- Chapter 7: Handling Censoring and Missing DataCensoring Mechanisms and Missing Data Patterns, Dealing with Informative Censoring, Imputation and Sensitivity Analysis Approaches, Interval-Censored and Left-Censored Data
- Chapter 8: Advanced Topics: Competing Risks and FrailtyIntroduction to Competing Risks Analysis, Cumulative Incidence Functions and Subdistribution Hazards, Frailty Models and Random Effects, Multistate Models and Transition Probabilities
- Chapter 9: Practical Implementation and SoftwareUsing R: The Survival Package and Beyond, Python Tools: Lifelines and Alternative Libraries, SAS, Stata, and Other Statistical Software, Building Reproducible Survival Analysis Workflows
- Chapter 10: Real-World Case Studies and ApplicationsClinical Trials: Analyzing Patient Survival Data, Reliability Engineering: Equipment Failure Analysis, Customer Analytics: Predicting Churn and Retention
- ConclusionKey Takeaways and Core Principles, Next Steps in Your Survival Analysis Journey
- Glossary of Terms
- Further Reading and Resources
Introduction
Time is at the heart of some of the most important questions in science, medicine, engineering, and business. How long will a patient survive after a cancer diagnosis? When is a machine component likely to fail? How quickly do customers stop using a subscription service? These questions share a common structure: they all involve measuring how long it takes for a specific event to occur. That shared structure is exactly what survival analysis is designed to handle, and it does so with a set of statistical tools that are both mathematically elegant and practically powerful.
What makes survival analysis different from ordinary regression or classification methods is its ability to work with incomplete observations. In most real-world studies, not every subject experiences the event of interest before the study ends. A patient may still be alive when the trial concludes. A machine may still be running when the monitoring period closes. A customer may still be subscribed when the data is pulled. These incomplete observations are called censored data, and handling them correctly is one of the defining challenges of time-to-event analysis. Standard statistical methods simply discard or mishandle censored observations, leading to biased and misleading results. Survival analysis was built specifically to use every piece of available information, including the incomplete observations.
This book is designed for people who already have a working knowledge of basic statistics and want to develop a solid, practical understanding of survival modeling. You do not need to be a mathematician or a professional statistician to benefit from this material. What you do need is a willingness to engage with both the concepts and the calculations, because survival analysis rewards careful thinking. Each chapter in this book builds on the previous one, moving from foundational ideas through increasingly sophisticated methods, always grounding the theory in concrete examples and real-world applications. By the time you finish, you will have the tools and the confidence to apply survival analysis to your own data, interpret your results correctly, and communicate your findings clearly.
Before diving into the technical content, this introduction sets the stage. It explains why survival analysis matters, where it is used across different fields, what specific skills and knowledge you will gain from this book, and how to get the most out of the material. Think of this chapter as your orientation guide. It gives you the map before you start the journey.
Why Survival Analysis Matters
Most introductory statistics courses focus on questions like: what is the average value of something, or is there a difference between two groups? These are important questions, but they are not always the right ones. When the outcome of interest is the time until something happens, a simple mean or a t-test is not enough. The timing of events carries information that summary statistics alone cannot capture, and ignoring that timing leads to poor decisions and incorrect conclusions.
Consider a clinical trial comparing two cancer treatments. Treatment A keeps patients alive for a median of 18 months, while Treatment B keeps patients alive for a median of 14 months. At first glance, Treatment A looks better. But what if Treatment B has a much higher proportion of patients surviving beyond five years? The median alone misses that crucial detail. Survival analysis gives you the full picture by estimating the entire distribution of survival times, not just a single summary number. That richer view changes how you interpret results and make decisions.
The problem of censoring is another reason survival analysis is indispensable. Suppose you are studying how long it takes new employees to leave a company. Some employees will have already left by the time you analyze the data. Others will still be employed. If you simply ignore the employees who have not yet left, you are throwing away real information and systematically underestimating how long people stay. If you treat their current tenure as their final tenure, you are making an assumption that is almost certainly wrong. Survival analysis handles this correctly by treating each observation according to what is actually known about it.
There is also the question of covariate effects. In many studies, you want to know not just when events happen, but what factors influence the timing. Does a patient's age affect how quickly they respond to treatment? Does the material composition of a component affect its failure rate? Does a customer's acquisition channel predict how long they stay? Survival regression models, particularly the Cox proportional hazards model, allow you to answer these questions while properly accounting for censoring and the time-varying nature of the outcome.
Survival analysis also matters because it is widely used and widely misused. Studies in medical journals, engineering reports, and business analytics frequently involve time-to-event data. When these analyses are done incorrectly, the consequences can be serious. A drug that appears effective may not be, or vice versa. A machine maintenance schedule may be set too conservatively or too aggressively. A customer retention strategy may be targeting the wrong segment. Understanding survival analysis properly means you can both conduct better analyses and critically evaluate the work of others.
Finally, survival analysis is a gateway to a broader family of statistical ideas. The concepts you learn here, including hazard functions, likelihood-based estimation, and model diagnostics, connect directly to other advanced topics in statistics and machine learning. Building a strong foundation in survival modeling sharpens your statistical intuition in ways that pay dividends across many other areas of quantitative work.
Applications Across Industries and Disciplines
One of the most compelling things about survival analysis is how broadly it applies. The same mathematical framework that a biostatistician uses to analyze patient outcomes can be used by an engineer studying component lifetimes, a sociologist studying time to marriage, or a data scientist modeling customer churn. The event changes, the context changes, but the underlying statistical structure remains the same. This universality makes survival analysis one of the most transferable skill sets in quantitative research.
In healthcare and clinical research, survival analysis is foundational. It is used to evaluate the effectiveness of treatments in randomized controlled trials, to study disease progression, to estimate prognosis for individual patients, and to compare outcomes across different patient populations. The landmark ECOG clinical trials in oncology, for example, have relied heavily on Kaplan-Meier curves and Cox regression to compare survival outcomes across treatment arms.[1] Regulatory agencies like the FDA routinely require survival analysis as part of the evidence package for new drug approvals.
In reliability engineering and manufacturing, the same methods go by different names. Engineers talk about "time to failure" rather than "survival time," and they use terms like "hazard rate" and "mean time between failures." The Weibull distribution, which you will study in Chapter 5, was developed specifically for reliability applications and remains a workhorse of industrial statistics. Companies use these methods to design maintenance schedules, set warranty periods, and improve product quality. A manufacturer of aircraft components, for instance, uses survival models to determine when parts should be replaced before they fail in service.
In business and customer analytics, survival analysis has become increasingly important as companies focus on customer lifetime value and retention. Churn modeling, which predicts when customers will stop using a product or service, is a direct application of survival analysis. Subscription businesses like streaming platforms, software-as-a-service companies, and telecommunications providers use these methods to identify at-risk customers, optimize pricing, and design retention campaigns. The key advantage over simpler logistic regression approaches is that survival models use the full history of each customer's tenure, not just a snapshot in time.
In social sciences and economics, survival analysis is used to study durations of all kinds. Economists study unemployment spells, asking how long it takes for a person to find a new job after losing one. Sociologists study the timing of life events like marriage, divorce, or first childbirth. Political scientists study how long governments or political regimes last. Criminologists study recidivism, measuring the time from release until reoffending. In each case, the time-to-event framework captures something that cross-sectional or simple longitudinal methods cannot.
In environmental science and ecology, survival analysis is used to study animal lifespans, plant survival under different conditions, and the persistence of ecological communities. Conservation biologists use these methods to estimate extinction risks and evaluate the effectiveness of habitat protection programs. Environmental engineers use them to model the degradation of pollutants in soil or water over time.
The table below summarizes some of the most common applications across fields, along with the typical event of interest and the type of data involved:
- Oncology: Time from diagnosis or treatment to death or disease recurrence
- Cardiology: Time to first major adverse cardiac event after intervention
- Reliability engineering: Time to mechanical or electrical component failure
- Customer analytics: Time from acquisition to subscription cancellation or churn
- Labor economics: Duration of unemployment spells between jobs
- Criminology: Time from prison release to reoffending
- Ecology: Lifespan of individual animals in a population study
- Finance: Time to default on a loan or bond
What unites all of these applications is the same core challenge: the outcome is a duration, observations may be incomplete, and the goal is to understand both the distribution of event times and the factors that influence them. Once you understand the framework in one context, you can apply it in any of the others. That is the power of learning survival analysis at a conceptual level rather than just memorizing formulas for a single domain.
What You'll Learn in This Book
This book covers survival analysis from the ground up, starting with the core concepts and building systematically toward advanced methods. The goal is not just to teach you formulas, but to help you develop genuine understanding. That means explaining why each method works the way it does, what assumptions it relies on, when those assumptions are likely to hold, and what to do when they do not. By the end, you will be equipped to make informed choices about which methods to use and how to interpret what they tell you.
The first part of the book, covered in Chapter 1, establishes the foundational vocabulary and concepts. You will learn what survival data looks like, how to define the event of interest and the time origin, and how to think about censoring. You will also be introduced to the two central mathematical objects in survival analysis: the survival function, which describes the probability of surviving beyond a given time, and the hazard function, which describes the instantaneous rate of experiencing the event at any given moment. These two functions are the lens through which all survival analysis is conducted.
Chapters 2 and 3 cover non-parametric methods. You will learn how to estimate survival curves using the Kaplan-Meier estimator, how to compute confidence intervals around those estimates, and how to compare survival curves between groups using statistical tests like the log-rank test. These methods make no assumptions about the shape of the underlying survival distribution, which makes them robust and widely applicable. They are also the most commonly reported methods in clinical research, so understanding them is essential for reading and evaluating published studies.
Chapter 4 introduces the Cox proportional hazards model, which is the most widely used regression method in survival analysis. You will learn how the model is structured, what the proportional hazards assumption means and how to check it, how the model is estimated using partial likelihood, and how to interpret hazard ratios. The Cox model is a semi-parametric method, meaning it makes assumptions about the effect of covariates but not about the baseline hazard function. This flexibility is one of the main reasons it has become so dominant in practice.
Chapter 5 moves into parametric survival models, including the exponential, Weibull, and lognormal distributions. These models make stronger assumptions than the Cox model, but they offer important advantages: they can extrapolate beyond the observed data, they provide smooth estimates of the hazard function, and they are often more efficient when the distributional assumptions are correct. You will learn how to fit these models, how to choose among them, and when parametric approaches are preferable to semi-parametric ones.
Chapters 6 and 7 address two critical practical topics: model diagnostics and the handling of censoring and missing data. No model is useful if its assumptions are badly violated, and no analysis is trustworthy if censoring has been handled incorrectly. These chapters give you the tools to check your models rigorously and to deal honestly with the messiness of real data. Topics include residual analysis, tests of the proportional hazards assumption, influential observation detection, informative censoring, and imputation strategies.
Chapter 8 covers advanced topics that extend the basic survival framework. Competing risks analysis handles situations where subjects can experience more than one type of event, and where the occurrence of one event prevents the others. Frailty models introduce random effects to account for unobserved heterogeneity, which is important when data comes from clustered or hierarchical structures. Multistate models generalize the framework further to allow subjects to move through a sequence of states over time. These methods are increasingly important in modern research and data science.
Chapter 9 focuses on practical implementation. You will see how to carry out survival analyses using R, Python, SAS, and Stata, with annotated code examples for the most common tasks. The chapter also covers best practices for building reproducible workflows, which is essential for professional and research settings. Finally, Chapter 10 brings everything together through three detailed case studies drawn from clinical trials, reliability engineering, and customer analytics, showing how the methods from earlier chapters are applied in realistic, end-to-end analyses.
How to Use This Guide
This book is structured to be read sequentially, and that is the recommended approach if you are new to survival analysis. Each chapter builds on concepts introduced in earlier ones, so skipping ahead can leave gaps that make later material harder to follow. That said, if you already have experience with some topics, the chapters are written to be reasonably self-contained, and you can use the table of contents to navigate to the areas most relevant to your current needs.
The mathematical content in this book is presented at an intermediate level. You will encounter formulas, and understanding them matters. But the emphasis is always on what the math means, not just what it says. Every formula is accompanied by an explanation of its components and an example of how it is used. If you find a particular derivation difficult, focus on understanding the result and its interpretation rather than getting stuck on the algebra. You can always return to the technical details once you have a clearer picture of the overall framework.
Throughout the book, you will find several recurring features designed to reinforce learning and support practical application:
- Worked examples: Step-by-step calculations that show exactly how methods are applied to specific datasets
- Conceptual explanations: Plain-language descriptions of what each method does and why it works
- Assumption checklists: Clear summaries of what each method requires and how to verify those requirements
- Code snippets: Annotated examples in R and Python showing how to implement each method
- Common pitfalls: Explicit warnings about mistakes that are frequently made in practice
- Footnotes and references: Citations to key papers and textbooks for those who want to go deeper
One of the most effective ways to learn survival analysis is to work with real data as you go. If you have a dataset from your own work or research, try applying each method to it as you encounter it in the book. Even if your data does not perfectly fit the examples, the process of trying to apply the methods will surface questions and insights that reading alone cannot provide. Several publicly available datasets are well-suited for practice, including the lung and veteran datasets in R's survival package, and the rossi recidivism dataset used in criminology research.
It is also worth being deliberate about the software you use. Chapter 9 covers multiple platforms, but if you are just starting out, R with the survival package is the most widely used tool in academic and research settings, and it has the most extensive documentation and community support.[2] Python's lifelines library is an excellent alternative if you are more comfortable in that ecosystem. Either way, the conceptual content of this book applies regardless of which software you use.
A note on notation: this book uses standard statistical notation throughout. The survival function is written as S(t), the hazard function as h(t), and the cumulative hazard function as H(t). Covariates are typically denoted as x or X, and regression coefficients as β. A glossary at the end of the book provides definitions for all key terms and symbols, so if you encounter something unfamiliar, that is a good first place to look.
Finally, approach this material with patience and curiosity. Survival analysis has a reputation for being difficult, and some of the concepts do require careful thought. But the core ideas are genuinely intuitive once you see them clearly, and the methods are among the most useful in all of applied statistics. The investment you make in understanding this material will pay off every time you encounter time-to-event data, which, as you will soon see, is far more often than you might expect.
The goal of this book is not to make you a passive consumer of survival analysis output, but an active, critical practitioner who understands what the methods are doing, why they work, and when to trust them. That kind of understanding is what separates good quantitative work from great quantitative work.
With that orientation in place, it is time to begin. Chapter 1 starts at the very foundation: what survival data actually looks like, how to define the key quantities of interest, and how to think about the problem of censoring. Everything else in the book builds from there. Let's get started.
Notes
Introduction
- 1. E. L. Kaplan and P. Meier, "Nonparametric estimation from incomplete observations," Journal of the American Statistical Association, 1958
- 2. T. M. Therneau, "A Package for Survival Analysis in R," R package version 3.5-7, 2023
This is the end of the free sample. The full book has 10 chapters.
Want this book written for you?
Tell us your goals and background, and get your own version of this book, tailored by AI to you.


Benefits of AI-tailored books
- Read one book, not ten:
- all the Statistics knowledge you need, gathered into a single book.
- Save days of learning:
- tell us your goals, choose your topics, and the whole book is built around them.
- Learn effortlessly:
- Statistics book written for your specific background and expertise.
- Understand at a glance:
- includes charts, tables, timelines, checklists, decision trees, and more.
- Stay current:
- written the day you order it, not years ago.
- Trust what you read:
- every book is checked for accuracy, with real research when your subject needs it.
Create your unique book in 3 steps
- 1. Select your focus
Select the focus of your Statistics book and share your background
- 2. Personalize your book
Specify your goals and choose sub-topics to include
- 3. Get your tailored book
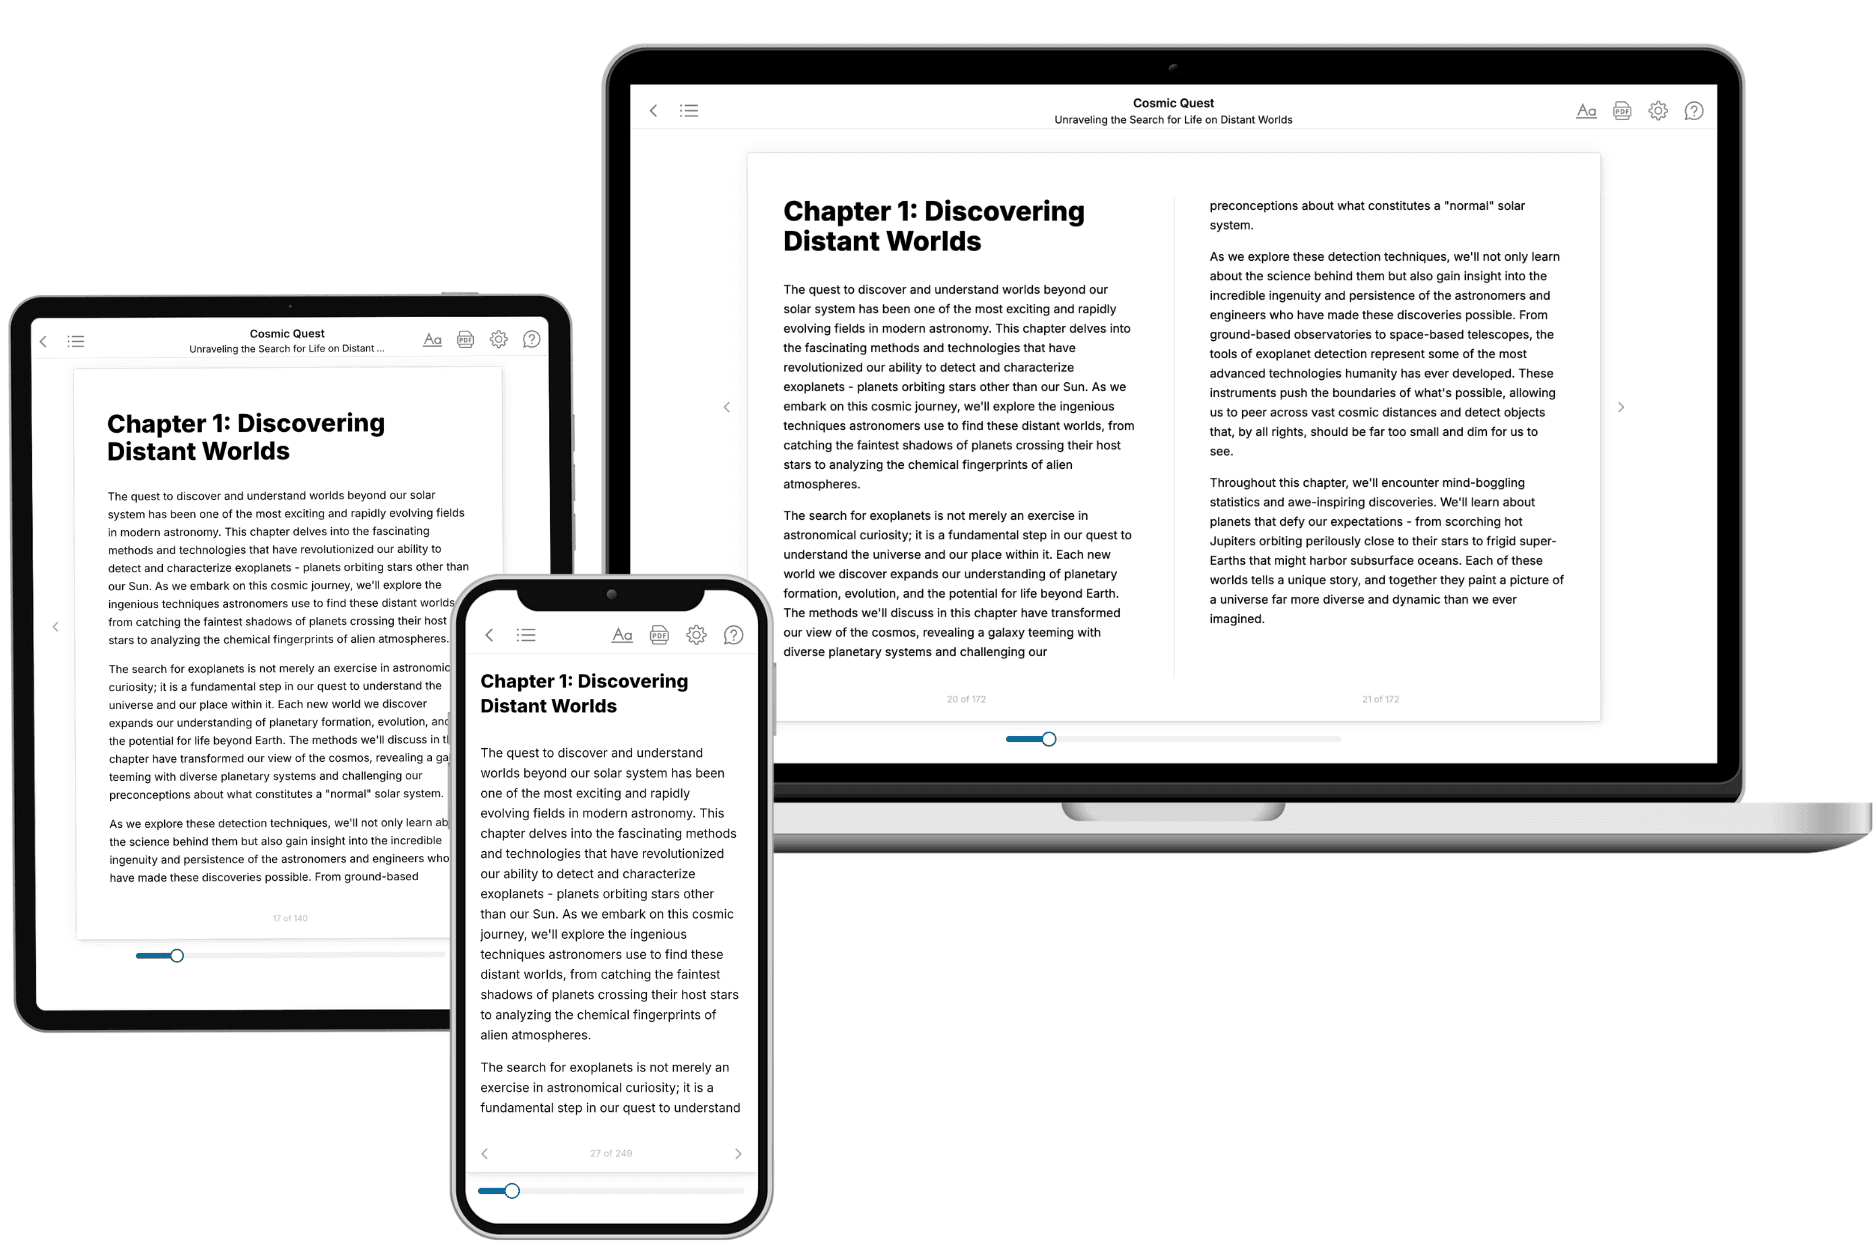
Your book is ready in 10 minutes. Read it online, download as EPUB or PDF, or send to Kindle.
Frequently asked questions
- What is TailoredRead?
TailoredRead creates complete, full-length nonfiction ebooks, written specifically for you. Tell us what you want to learn and why, and TailoredRead writes you a complete ebook on it, with charts, tables, and diagrams throughout. Read it online, on Kindle, or on any e-reader, or download it as a PDF or EPUB. Every book is written fresh the day you order it.
- How is the book tailored to me?
Before anything is written, you answer a few short questions about your goals, your background, and the topics you care about. Your book is then planned around your answers: written at your level, focused on your goals, and covering the topics you chose, instead of the one-size-fits-all book a store sells everyone.
- Will it read like generic AI content?
No. Your book isn't a chat transcript: it's planned chapter by chapter before a single word is written, told in a clear book voice, and explains ideas visually with charts, tables, and diagrams. After writing, every book goes through an editorial pass that polishes chapters so the book reads consistent from start to finish. Judge for yourself: browse thousands of sample books on our Explore Books page.
- How accurate is the content?
Our AI first checks whether your subject needs live research. Niche and fast-moving subjects are researched before writing, and the book plan and chapters are grounded in what it finds. After writing, every book goes through a quality pass that checks its facts and consistency, and researched books list their sources in a Notes section at the back.
- How long is the book?
You choose the length: Comprehensive (250-300 pages), Detailed (150-200 pages), Essential (70-100 pages), or Short (30-50 pages).
- Does the book include visuals?
Yes. Every book includes charts, tables, and diagrams: timelines, checklists, step-by-step guides, decision trees, comparison tables, matrices, and bar charts. A typical book includes dozens of these visual elements.
- Can I read it on Kindle? What formats can I download?
Yes. Every book can be read in our online reader or downloaded as a PDF or EPUB. The EPUB can be opened with Kindle, Apple Books, Kobo, and any e-reader. The Commercial and Author licenses also include an editable Word (DOCX) and Markdown download.
- How much does it cost?
About the price of a regular ebook. The exact price depends on your book's length and complexity, from $2 for the shortest books to $35 for the most comprehensive, and it's shown when you review your book, before you commit to anything. Each book is a one-time purchase, yours to keep, no subscription. Licenses that let you share, teach, or publish your book range from $35.99 to $49.99.
- Can I preview the book before purchasing?
Before you pay, you'll see what your book will cover: the title, a detailed description, the estimated length, and the complete chapter-by-chapter table of contents, so you know what you're getting before you decide. The full text itself is written after you purchase.
- How long does it take to create a book?
About 10 minutes. You can start reading the opening chapters while the rest is still being written.