The Thematic Map Explorer
Unlocking Hidden Patterns in Our World Through the Art and Science of Geographic Visualization
Picture yourself standing before a world map that doesn't just show countries and borders, but reveals the invisible threads connecting climate patterns to ancient trade routes, population density to natural resources, and cultural traditions to geographic features.
284 pages16 chaptersSep 15, 2025Geography
About this book
You can see how mountain ranges influence rainfall patterns, how rivers shaped civilizations, and how modern transportation networks follow paths carved by geography thousands of years ago. This comprehensive guide transforms how you see and understand our world through the lens of thematic mapping. You'll discover how these specialized maps serve as windows into complex geographic relationships, revealing patterns that remain hidden in traditional atlases. From planning your next adventure with elevation and climate maps to understanding global phenomena through population and economic visualizations, you'll develop the skills to read the stories that landscapes tell. Whether you're plotting hiking routes through national parks, researching destinations for international travel, or simply curious about the forces that shape our planet, this book provides practical techniques for interpreting and creating thematic maps. You'll learn to recognize the visual language of cartography, understand how different mapping methods reveal different truths, and develop critical thinking skills for evaluating geographic information. By the end of this exploration, you'll possess a cartographer's eye for seeing beyond surface features to the deeper patterns that connect places, peoples, and phenomena across our interconnected world. Every map you encounter will become a gateway to richer understanding and more meaningful travel experiences.
Table of contents
- IntroductionHow Maps Tell Stories, Beyond Political Boundaries, Your Mapping Journey Ahead, How to Use This BookRead below
- Chapter 1: Foundations of Thematic MappingWhat Makes Maps Thematic, The Evolution of Thematic Maps, Types of Geographic Data, Understanding Spatial Relationships
- Chapter 2: Essential Cartographic PrinciplesMap Projections Explained, Scale and Resolution, Coordinate Systems and Reference Frames, Generalization Techniques
- Chapter 3: Visual Design PrinciplesColor Theory in Mapping, Creating Visual Hierarchy, Typography and Labeling, Symbols and Legends
- Chapter 4: Choropleth Mapping TechniquesUnderstanding Choropleth Maps, Data Classification Methods, Color Schemes for Statistical Data, Avoiding Common Pitfalls
- Chapter 5: Isoline and Contour MappingPrinciples of Isolines, Reading Topographic Maps, Climate and Weather Maps, Interpolation Techniques
- Chapter 6: Dot Density and Point Pattern MappingDot Density Fundamentals, Point Pattern Analysis, Graduated Symbol Maps, Clustering Techniques
- Chapter 7: Flow and Movement MapsVisualizing Movement Patterns, Flow Line Maps, Migration and Trade Patterns, Network Analysis
- Chapter 8: Physical Geography MappingElevation and Terrain Mapping, Geological Maps, Hydrological Features, Natural Hazards Mapping
- Chapter 9: Climate and Weather MappingClimate Classification Systems, Precipitation Patterns, Temperature Mapping, Seasonal Variations
- Chapter 10: Human Geography PatternsPopulation Distribution, Urban and Rural Patterns, Cultural Landscapes, Transportation Networks
- Chapter 11: Travel and Tourism MappingDestination Analysis, Route Planning Maps, Recreational Opportunities, Seasonal Tourism Patterns
- Chapter 12: Outdoor Adventure MappingTrail and Hiking Maps, Wilderness Navigation, Safety and Risk Assessment, Seasonal Considerations
- Chapter 13: Digital Mapping Tools and TechnologiesGIS Software Overview, Web Mapping Platforms, Mobile Mapping Applications, Finding Reliable Data Sources
- Chapter 14: Creating Your Own Thematic MapsPlanning Your Map Project, Data Collection and Preparation, Design and Implementation, Testing and Refinement
- Chapter 15: Critical Map Reading SkillsIdentifying Bias and Limitations, Evaluating Data Accuracy, Understanding Historical Context, Comparing Multiple Sources
- Chapter 16: Advanced Mapping TechniquesMulti-variable Mapping, Temporal Mapping, Three-dimensional Visualization, Interactive Map Elements
- ConclusionDeveloping a Mapping Mindset, The Future of Thematic Mapping
Introduction
Imagine standing at the edge of the Grand Canyon, gazing across layers of rock that tell the story of millions of years. Now picture holding a map that reveals not just the canyon's shape, but the geological forces that carved it, the climate patterns that shaped its ecosystem, and the human history woven into its landscape. This is the power of thematic mapping – transforming static geographic information into dynamic stories that connect the physical world with the patterns of life, culture, and natural phenomena that flow across it. Unlike traditional maps that simply show where things are located, thematic maps reveal why they are there, how they relate to each other, and what hidden connections exist beneath the surface.
Every landscape holds secrets waiting to be discovered through the lens of thematic mapping. When you understand how to read these specialized visualizations, a topographic map becomes a three-dimensional story of ancient mountain-building and erosion. A climate map transforms into a guide for predicting weather patterns and planning seasonal adventures. Population density maps reveal the invisible threads connecting natural resources, transportation networks, and human settlement patterns that have evolved over centuries. These maps serve as bridges between raw geographic data and meaningful understanding, turning numbers and statistics into visual narratives that enhance your appreciation of any place you visit or explore.
The art and science of thematic mapping has evolved dramatically from hand-drawn charts created by early explorers to sophisticated digital visualizations powered by satellite data and advanced computing. Today's thematic maps can display real-time information, layer multiple data sets for complex analysis, and provide interactive experiences that allow you to explore geographic relationships in unprecedented detail. Whether you're planning a hiking expedition through national parks, researching climate conditions for international travel, or simply curious about the forces that shape our world, mastering thematic map interpretation opens doors to deeper geographic literacy and more informed decision-making in your adventures and explorations.
How Maps Tell Stories
Every thematic map functions as a visual storyteller, weaving together geographic data to reveal narratives that would remain hidden in spreadsheets or written reports. Consider how a simple elevation map of the western United States immediately explains why cities like Denver and Salt Lake City developed where they did – positioned at strategic points where mountain passes meet river valleys, creating natural corridors for transportation and trade. The map doesn't just show elevation numbers; it tells the story of how topography influenced human settlement patterns, economic development, and cultural exchange across centuries. This storytelling power emerges from the map's ability to make spatial relationships visible, allowing your eye to trace connections between cause and effect across vast geographic scales.
The narrative structure of thematic maps operates through carefully chosen visual elements that guide your interpretation of complex geographic phenomena. Color gradients might tell the story of temperature variations across a continent, with warm reds flowing into cool blues to show how latitude, elevation, and ocean currents interact to create climate zones. Symbol sizes can narrate population growth stories, with larger circles representing major urban centers and smaller dots showing rural communities, revealing patterns of urbanization and demographic change. Line thickness on flow maps tells stories of trade routes, migration patterns, or river systems, with heavier lines indicating greater volume or importance in the geographic narrative being presented.
Historical thematic maps serve as time machines, preserving stories of how geographic patterns have evolved and changed over decades or centuries. A series of maps showing forest cover in the Amazon basin over the past fifty years tells a powerful story of deforestation, conservation efforts, and the complex relationship between human development and environmental preservation. Similarly, maps tracking the expansion of transportation networks reveal stories of technological progress, economic development, and changing patterns of connectivity between regions. These temporal narratives help you understand that geography is not static – landscapes, climate patterns, and human activities are constantly evolving, creating new stories that future maps will tell.
The most compelling thematic maps tell multiple interconnected stories simultaneously, layering different types of geographic information to reveal complex relationships and patterns. A map combining elevation data, precipitation patterns, and vegetation zones tells the integrated story of how physical geography creates ecological niches and biodiversity hotspots. When you add human elements like population density and transportation networks, the story expands to include how people adapt to and modify their physical environment. These multi-layered narratives demonstrate that geographic phenomena rarely exist in isolation – understanding one element often requires seeing how it connects to and influences other aspects of the geographic system.
Modern digital mapping technologies have revolutionized the storytelling potential of thematic maps by enabling interactive narratives that respond to your curiosity and interests. Interactive maps allow you to explore different aspects of a geographic story by toggling layers on and off, zooming into specific regions for detailed analysis, or animating changes over time to see how patterns evolve. For example, an interactive climate map might let you explore how temperature and precipitation patterns change seasonally, revealing stories about agricultural cycles, wildlife migration, and tourism seasons that static maps cannot convey as effectively.
The storytelling power of thematic maps extends beyond academic or scientific applications to enhance personal experiences and adventures. When planning a road trip through national parks, elevation and climate maps tell stories about what landscapes and weather conditions you'll encounter at different times of year. Trail maps combined with topographic information tell stories about difficulty levels, scenic viewpoints, and potential hazards along hiking routes. Cultural and historical maps tell stories about the human heritage of places you visit, connecting present-day landscapes with the events, traditions, and peoples that shaped them over time.
Understanding how maps tell stories also means recognizing that every thematic map represents choices made by its creator about which stories to emphasize and which to downplay or omit entirely. The selection of data, classification methods, color schemes, and scale all influence the narrative that emerges from the visualization. A population density map using different classification breaks might tell dramatically different stories about urban concentration or rural distribution patterns. This awareness of the constructed nature of map narratives is essential for developing critical map reading skills and understanding that maps, while powerful storytelling tools, always represent particular perspectives on complex geographic realities.
The stories told by thematic maps become most meaningful when you bring your own knowledge, experiences, and questions to the interpretation process. Your background understanding of history, culture, science, or personal familiarity with specific places adds depth and context to the narratives revealed by thematic maps. A climate map of a region you've visited tells a richer story because you can connect the abstract data visualization with your memories of actual weather conditions, seasonal changes, and how climate influenced your activities and experiences. This personal connection transforms map reading from a passive consumption of information into an active dialogue between your knowledge and the geographic stories being presented.
Beyond Political Boundaries
Traditional political maps, with their emphasis on national borders, state lines, and administrative divisions, represent just one way of organizing and understanding geographic space. While these boundaries are important for governance, citizenship, and political identity, they often obscure the natural and cultural patterns that flow across political lines without regard for human-drawn borders. Thematic maps liberate geographic understanding from these artificial constraints, revealing how phenomena like climate zones, ecosystems, cultural regions, and economic systems operate according to their own geographic logic. Mountain ranges don't stop at national borders, river systems flow through multiple countries, and cultural traditions often span political boundaries that were drawn long after these patterns were established.
Climate patterns provide compelling examples of how natural phenomena transcend political boundaries in ways that thematic maps can illuminate clearly. The Mediterranean climate zone extends across parts of California, Chile, South Africa, Australia, and the Mediterranean Basin itself, creating similar landscapes, vegetation, and agricultural possibilities despite vast distances and different political systems. A thematic map showing global climate zones reveals these connections immediately, helping you understand why wine production, olive cultivation, and similar architectural styles appear in these widely separated regions. Political maps would show these areas as completely separate entities, missing the fundamental environmental connections that explain their shared characteristics.
Ecosystem boundaries follow natural rather than political logic, creating bioregions that thematic maps can display more accurately than traditional political cartography. The Greater Yellowstone Ecosystem, for example, extends across parts of Wyoming, Montana, and Idaho, encompassing a complex network of habitats that support wildlife populations requiring large territories for seasonal migration and breeding. Thematic maps showing ecosystem boundaries, wildlife corridors, and habitat connectivity reveal the true geographic extent of this natural system, information that is essential for conservation planning, wildlife management, and understanding how human activities in one political jurisdiction can affect ecological processes across the entire region.
Cultural and linguistic regions often span multiple political boundaries, creating patterns that thematic maps can reveal more effectively than traditional political cartography. The Kurdish cultural region extends across parts of Turkey, Syria, Iraq, and Iran, representing a distinct cultural and linguistic area that doesn't correspond to any single political entity. Similarly, the Spanish-speaking regions of the Americas share cultural, linguistic, and historical connections that transcend national boundaries. Thematic maps showing language distributions, cultural practices, or historical connections help you understand these broader regional identities and the ways that culture flows across political lines.
Economic regions and trade patterns frequently operate on scales that ignore political boundaries, creating functional geographic units based on economic relationships rather than political control. The Great Lakes region of North America functions as an integrated economic system encompassing parts of eight U.S. states and two Canadian provinces, connected by shared transportation networks, industrial heritage, and economic interdependence. Thematic maps showing trade flows, economic indicators, or industrial concentrations reveal these functional economic regions and help explain why certain areas prosper or decline together regardless of their political affiliations.
Transportation and communication networks create their own geographic logic that often conflicts with political boundary systems. Major river systems like the Mississippi, Amazon, or Danube create natural transportation corridors that connect regions across multiple political jurisdictions. Similarly, mountain passes, coastal routes, and other natural corridors for movement follow topographic rather than political logic. Thematic maps showing transportation networks, communication flows, or accessibility patterns reveal how geographic connectivity operates independently of political organization, creating functional regions based on ease of movement and communication rather than administrative control.
Environmental challenges and natural hazards operate on scales that frequently transcend political boundaries, requiring regional or global perspectives that thematic maps can provide effectively. Air pollution from industrial centers affects air quality across vast regions regardless of political boundaries. Watershed systems connect upstream and downstream areas across multiple political jurisdictions, making water quality and flood management inherently regional issues. Climate change impacts operate on global scales that make national-level analysis insufficient for understanding the full scope of environmental challenges and opportunities.
Understanding geographic patterns beyond political boundaries enhances your ability to plan travel and outdoor adventures by revealing natural and cultural connections that political maps obscure. When planning a hiking trip through the Appalachian Mountains, thematic maps showing elevation, climate, and ecosystem patterns help you understand how conditions will change as you move through different sections of the mountain system, regardless of which states you're passing through. Similarly, cultural and historical thematic maps can reveal regional identities and traditions that span political boundaries, enriching your understanding of the places you visit and the people you encounter.
The digital age has made it easier than ever to access and create thematic maps that reveal patterns beyond political boundaries, but it has also highlighted the importance of understanding how political and natural systems interact. While ecosystems, climate zones, and cultural regions follow their own geographic logic, political boundaries still matter enormously for governance, resource management, and policy implementation. The most sophisticated thematic mapping approaches recognize both the natural patterns that transcend political boundaries and the political realities that shape how these patterns are managed, protected, or modified by human activities and institutions.
Your Mapping Journey Ahead
Your exploration of thematic mapping will unfold as a progressive journey from basic map reading skills to sophisticated analysis techniques that transform how you see and understand geographic relationships. This journey begins with developing visual literacy – learning to decode the symbolic language that cartographers use to represent complex geographic phenomena through colors, symbols, patterns, and spatial arrangements. You'll discover how different types of thematic maps serve specific purposes, from choropleth maps that show statistical variations across regions to isoline maps that reveal continuous phenomena like elevation or temperature. Each mapping technique you master adds new dimensions to your geographic understanding and expands your ability to extract meaningful insights from spatial data.
The early stages of your mapping journey focus on building foundational skills that apply across all types of thematic maps. You'll learn to interpret legends, understand scale relationships, and recognize how map projections affect the representation of geographic phenomena. These fundamental skills provide the framework for more advanced techniques, ensuring that you can approach any thematic map with confidence and extract accurate information regardless of its specific focus or design approach. Understanding these basics also prepares you to create your own thematic maps, whether for personal travel planning, professional projects, or sharing geographic insights with others.
As your skills develop, you'll explore specialized mapping techniques designed for different types of geographic phenomena and analysis purposes. Physical geography mapping will teach you to read the stories written in landscapes through elevation models, geological maps, and hydrological visualizations. Climate and weather mapping will reveal how atmospheric patterns create the environmental conditions that shape ecosystems, agriculture, and human activities. Human geography mapping will show you how population, culture, and economic activities create patterns across space and time. Each specialized area builds on your foundational skills while introducing new concepts and techniques specific to particular types of geographic analysis.
The middle portion of your journey emphasizes practical applications that connect thematic mapping skills to real-world activities and interests. You'll learn how to use thematic maps for travel planning, discovering how elevation maps, climate data, and cultural information can enhance your destination research and route planning. Outdoor adventure mapping will show you how topographic maps, trail information, and safety data combine to support wilderness navigation and risk assessment. These practical applications demonstrate how thematic mapping skills translate into better decision-making and richer experiences in your personal adventures and explorations.
Technology integration represents a crucial component of your mapping journey, as digital tools have revolutionized both the creation and consumption of thematic maps. You'll explore Geographic Information Systems (GIS) software, web-based mapping platforms, and mobile applications that put sophisticated mapping capabilities at your fingertips. Learning to navigate these digital tools opens access to vast databases of geographic information and enables you to create custom maps tailored to your specific interests and needs. However, technology mastery goes hand-in-hand with understanding the principles behind effective map design and critical evaluation of digital geographic information.
Advanced techniques in your mapping journey will challenge you to work with multiple variables, temporal data, and complex spatial relationships that require sophisticated analytical approaches. You'll learn to create and interpret multi-layered visualizations that reveal interactions between different geographic phenomena, such as how climate, topography, and human activities combine to create unique regional characteristics. Temporal mapping techniques will show you how to analyze changes over time, revealing trends and patterns that static maps cannot capture. These advanced skills prepare you to tackle complex geographic questions and contribute to discussions about environmental change, urban planning, and regional development.
Critical thinking skills development runs throughout your entire mapping journey, ensuring that you become not just a consumer of thematic maps but a thoughtful analyst who can evaluate the quality, accuracy, and limitations of geographic visualizations. You'll learn to identify potential sources of bias, understand how data collection methods affect map accuracy, and recognize when maps might be misleading or incomplete. These critical evaluation skills are essential in an era of abundant digital geographic information, where the ability to distinguish reliable sources from questionable ones determines the value of your geographic analysis and decision-making.
Your mapping journey culminates in developing what might be called a "geographic imagination" – the ability to think spatially about problems, opportunities, and relationships in your daily life and broader interests. This geographic perspective influences how you approach travel planning, understand news events, evaluate environmental issues, and appreciate the places you live and visit. You'll find yourself naturally thinking about spatial patterns, geographic connections, and the ways that location influences everything from economic opportunities to cultural traditions to environmental conditions.
The skills and perspectives you develop through this mapping journey extend far beyond technical cartographic knowledge to enhance your overall understanding of how the world works. Geographic literacy has become increasingly important in addressing global challenges like climate change, urbanization, resource management, and cultural understanding. Your thematic mapping skills contribute to this broader geographic literacy, enabling you to participate more effectively in discussions about regional planning, environmental protection, and sustainable development. Whether you apply these skills professionally or personally, they provide tools for understanding and engaging with the complex geographic realities of our interconnected world.
How to Use This Book
This book is designed as both a comprehensive reference and a practical guide that you can adapt to your specific interests, skill level, and learning goals. The chapters are organized in a logical progression from fundamental concepts to advanced techniques, but you don't need to read them in strict sequential order. If you're already familiar with basic cartographic principles, you might skip ahead to specialized mapping techniques that interest you most. Conversely, if you're new to thematic mapping, spending extra time with the foundational chapters will provide a solid base for understanding more complex concepts later. Each chapter includes cross-references to related topics in other sections, helping you navigate connections between different aspects of thematic mapping.
The practical examples and case studies throughout the book are chosen to demonstrate real-world applications of thematic mapping concepts across diverse geographic contexts and scales. You'll find examples ranging from local trail maps for weekend hiking trips to global climate visualizations that reveal planetary-scale patterns. These examples serve multiple purposes: they illustrate abstract concepts with concrete applications, provide templates you can adapt for your own mapping projects, and demonstrate how the same techniques apply across different scales and contexts. When working through examples, try to think about how you might modify the approach for your own geographic interests or local area.
Interactive exercises and hands-on activities are integrated throughout each chapter to reinforce learning and provide opportunities to practice new skills immediately. These activities range from simple map interpretation exercises using provided examples to more complex projects that require you to locate data sources and create original thematic maps. Some exercises can be completed with basic tools like colored pencils and graph paper, while others utilize free online mapping platforms or software. The progression of activities is designed to build confidence gradually, starting with guided practice and moving toward independent application of mapping concepts.
The digital resources and online tools referenced throughout the book are carefully selected to provide free or low-cost access to mapping capabilities and geographic data. Rather than focusing on expensive professional software, the emphasis is on accessible tools that anyone can use to explore thematic mapping concepts and create meaningful visualizations. However, the principles and techniques you learn apply equally well to professional-grade mapping software, so your skills will transfer readily if you later choose to work with more advanced tools. Web links and resource lists are updated regularly to ensure continued access to recommended platforms and data sources.
Each chapter concludes with a summary of key concepts, a glossary of important terms, and suggestions for further exploration that connect chapter topics to broader geographic themes and current research. These resources help you consolidate your learning and identify areas where you might want to deepen your understanding through additional reading or practice. The suggested explorations often include links to current mapping projects, research studies, or online communities where you can see thematic mapping techniques applied to contemporary geographic challenges and opportunities.
The book's structure accommodates different learning styles and preferences through multiple pathways for engaging with the material. Visual learners will benefit from the extensive use of map examples, diagrams, and step-by-step illustrations that show mapping techniques in action. Hands-on learners can focus on the practical exercises and mapping projects that provide opportunities to apply concepts immediately. Analytical learners will appreciate the detailed explanations of cartographic principles and the critical thinking frameworks for evaluating map quality and accuracy. Regardless of your preferred learning style, the combination of theory, examples, and practice ensures multiple opportunities to master each concept.
For readers with specific applications in mind, such as travel planning or outdoor recreation, targeted sections throughout the book address these specialized uses while connecting them to broader thematic mapping principles. Travel-focused readers might pay particular attention to chapters on climate mapping, cultural geography, and route planning techniques. Outdoor enthusiasts will find detailed coverage of topographic mapping, wilderness navigation, and safety applications. However, even specialized readers will benefit from understanding the foundational concepts that underlie all effective thematic mapping, as these principles improve your ability to evaluate and use any type of geographic visualization.
The book encourages active engagement with mapping concepts through reflection questions, discussion prompts, and project suggestions that help you connect new learning to your existing knowledge and interests. These elements are designed to transform passive reading into active learning, encouraging you to think critically about geographic patterns in your own environment and experiences. Many of the reflection questions can serve as starting points for mapping projects or research investigations that extend your learning beyond the book itself.
Finally, this book serves as a foundation for lifelong learning about thematic mapping and geographic analysis. The field of cartography continues to evolve rapidly with new technologies, data sources, and visualization techniques emerging regularly. The principles and critical thinking skills you develop through this book provide a stable foundation for evaluating and adopting new mapping tools and techniques as they become available. The goal is not just to teach you current mapping methods, but to develop your capacity for continued learning and adaptation in a dynamic field where geographic information and visualization capabilities are constantly expanding and improving.
This is the end of the free sample. The full book has 16 chapters.
Want this book written for you?
Tell us your goals and background, and get your own version of this book, tailored by AI to you.


Benefits of AI-tailored books
- Read one book, not ten:
- all the Geography knowledge you need, gathered into a single book.
- Save days of learning:
- tell us your goals, choose your topics, and the whole book is built around them.
- Learn effortlessly:
- Geography book written for your specific background and expertise.
- Understand at a glance:
- includes charts, tables, timelines, checklists, decision trees, and more.
- Stay current:
- written the day you order it, not years ago.
- Trust what you read:
- every book is checked for accuracy, with real research when your subject needs it.
Create your unique book in 3 steps
- 1. Select your focus
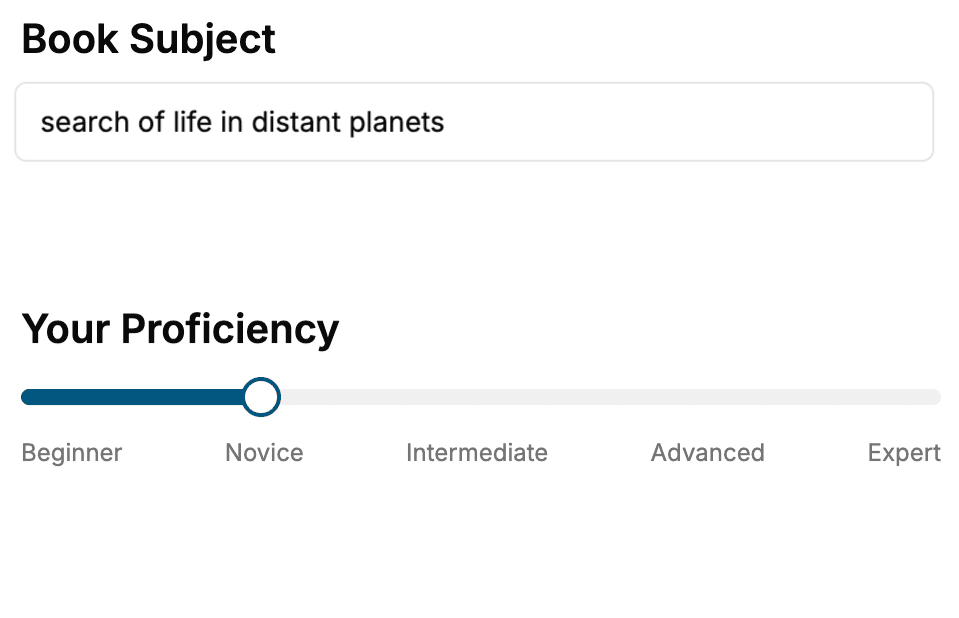
Select the focus of your Geography book and share your background
- 2. Personalize your book
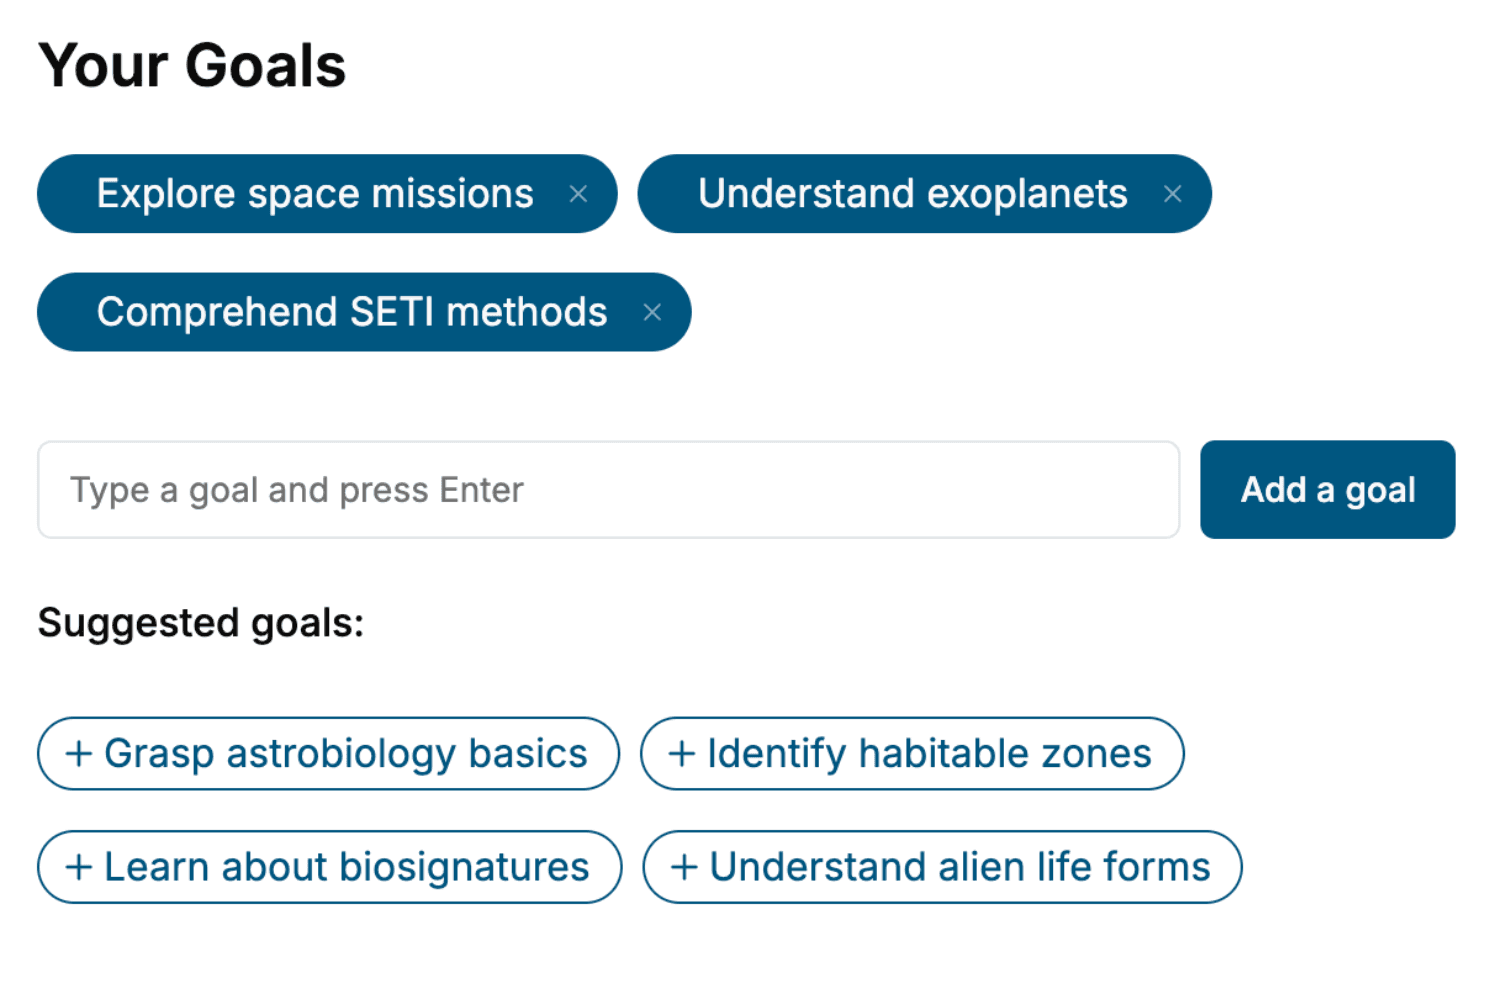
Specify your goals and choose sub-topics to include
- 3. Get your tailored book
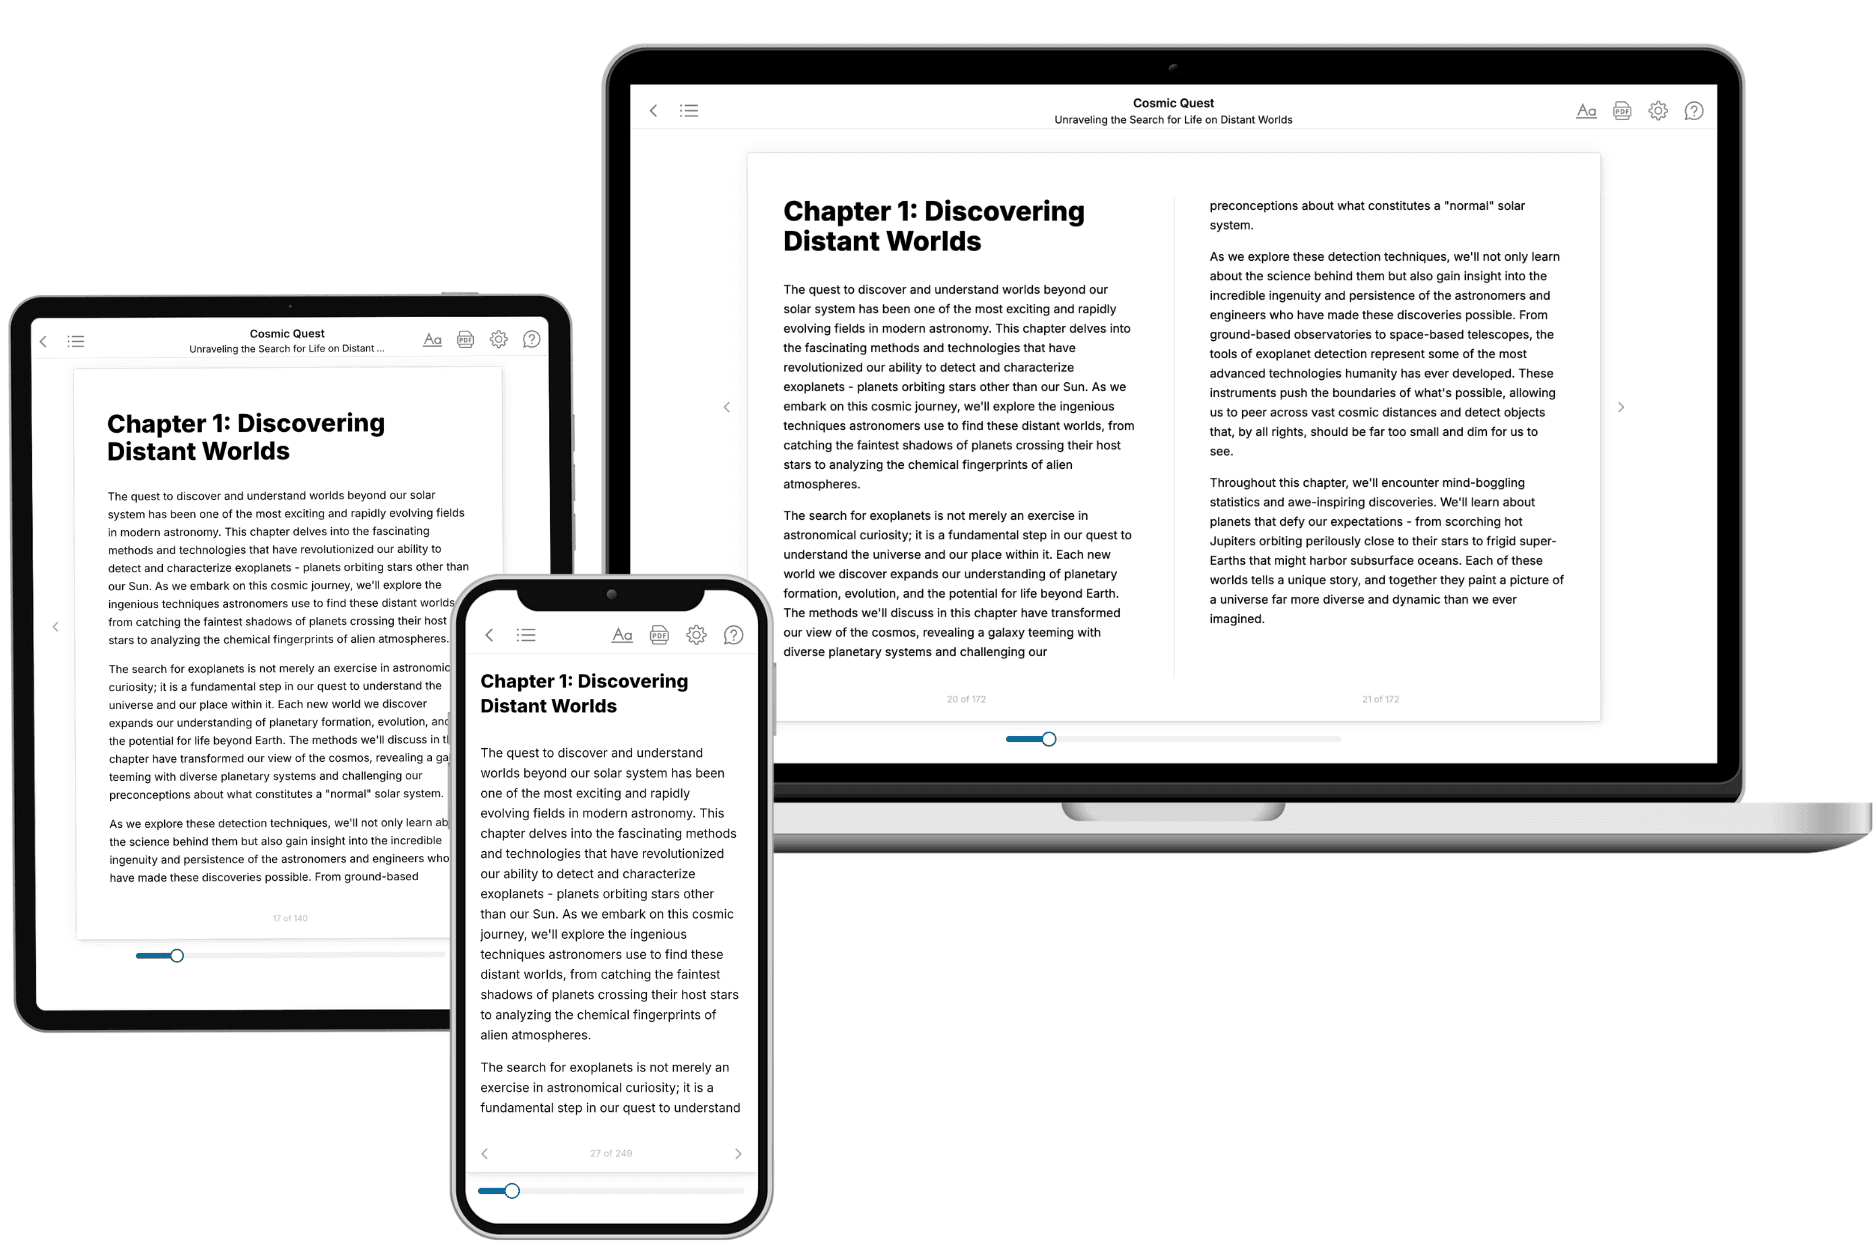
Your book is ready in 10 minutes. Read it online, download as EPUB or PDF, or send to Kindle.
Frequently asked questions
- What is TailoredRead?
TailoredRead creates complete, full-length nonfiction ebooks, written specifically for you. Tell us what you want to learn and why, and TailoredRead writes you a complete ebook on it, with charts, tables, and diagrams throughout. Read it online, on Kindle, or on any e-reader, or download it as a PDF or EPUB. Every book is written fresh the day you order it.
- How is the book tailored to me?
Before anything is written, you answer a few short questions about your goals, your background, and the topics you care about. Your book is then planned around your answers: written at your level, focused on your goals, and covering the topics you chose, instead of the one-size-fits-all book a store sells everyone.
- Will it read like generic AI content?
No. Your book isn't a chat transcript: it's planned chapter by chapter before a single word is written, told in a clear book voice, and explains ideas visually with charts, tables, and diagrams. After writing, every book goes through an editorial pass that polishes chapters so the book reads consistent from start to finish. Judge for yourself: browse thousands of sample books on our Explore Books page.
- How accurate is the content?
Our AI first checks whether your subject needs live research. Niche and fast-moving subjects are researched before writing, and the book plan and chapters are grounded in what it finds. After writing, every book goes through a quality pass that checks its facts and consistency, and researched books list their sources in a Notes section at the back.
- How long is the book?
You choose the length: Comprehensive (250-300 pages), Detailed (150-200 pages), Essential (70-100 pages), or Short (30-50 pages).
- Does the book include visuals?
Yes. Every book includes charts, tables, and diagrams: timelines, checklists, step-by-step guides, decision trees, comparison tables, matrices, and bar charts. A typical book includes dozens of these visual elements.
- Can I read it on Kindle? What formats can I download?
Yes. Every book can be read in our online reader or downloaded as a PDF or EPUB. The EPUB can be opened with Kindle, Apple Books, Kobo, and any e-reader. The Commercial and Author licenses also include an editable Word (DOCX) and Markdown download.
- How much does it cost?
About the price of a regular ebook. The exact price depends on your book's length and complexity, from $2 for the shortest books to $35 for the most comprehensive, and it's shown when you review your book, before you commit to anything. Each book is a one-time purchase, yours to keep, no subscription. Licenses that let you share, teach, or publish your book range from $35.99 to $49.99.
- Can I preview the book before purchasing?
Before you pay, you'll see what your book will cover: the title, a detailed description, the estimated length, and the complete chapter-by-chapter table of contents, so you know what you're getting before you decide. The full text itself is written after you purchase.
- How long does it take to create a book?
About 10 minutes. You can start reading the opening chapters while the rest is still being written.