Thermal Analysis Calorimetry
Master the Science of Heat Measurement and Material Characterization
Many researchers approach thermal analysis as a black box—insert sample, get data, interpret results.
207 pages10 chaptersAug 12, 2026Analytical Chemistry
About this book
But without understanding the underlying principles and practical nuances, you'll miss critical insights and struggle with inconsistent results. This guide demystifies thermal analysis and calorimetry, bridging the gap between theory and laboratory practice. You'll learn how different calorimetric techniques work, when to use each method, and how to design experiments that yield reliable, reproducible data. From instrument calibration and sample preparation to data interpretation and troubleshooting, this book equips you with the knowledge to confidently apply thermal analysis in your research. Whether you're characterizing polymers, studying phase transitions, or investigating reaction kinetics, you'll discover practical strategies to maximize data quality and extract meaningful conclusions from your thermal measurements.
Table of contents
- IntroductionWhy Thermal Analysis Matters in Modern Chemistry, What This Book Covers and How to Use It, The Thermal Analysis Landscape: Techniques and ApplicationsRead below
- Chapter 1: Fundamentals of Thermal AnalysisThermodynamic Principles and Heat Flow, How Heat Is Measured: From Theory to Practice, Key Thermal Properties and What They Tell You
- Chapter 2: Types of Calorimetry and Their ApplicationsDifferential Scanning Calorimetry (DSC): Principles and Uses, Thermogravimetric Analysis (TGA): Measuring Mass Changes, Isothermal Titration Calorimetry (ITC): Binding and Interactions, Other Thermal Techniques: DMA, TMA, and Beyond
- Chapter 3: Instrument Setup and CalibrationUnderstanding Your Instrument: Key Components and Functions, Calibration Protocols: Temperature, Heat Flow, and Baseline, Routine Maintenance and Preventing Common Issues
- Chapter 4: Sample Preparation and Experimental DesignSelecting and Preparing Samples for Optimal Results, Sample Mass, Geometry, and Container Selection, Designing Experiments: Temperature Ramps, Isothermal Holds, and Atmospheres
- Chapter 5: Differential Scanning Calorimetry in PracticeDSC Experimental Methodology and Best Practices, Interpreting DSC Data: Peaks, Transitions, and Artifacts, Real-World DSC Applications: Polymers, Pharmaceuticals, and Materials
- Chapter 6: Thermogravimetric Analysis in PracticeTGA Experimental Methodology and Heating Strategies, Interpreting TGA Data: Decomposition, Degradation, and Moisture, Real-World TGA Applications: Thermal Stability and Composition Analysis
- Chapter 7: Isothermal Titration Calorimetry in PracticeITC Experimental Methodology and Titration Design, Interpreting ITC Data: Binding Constants and Thermodynamic Parameters, Real-World ITC Applications: Protein Interactions and Binding Studies
- Chapter 8: Data Analysis and InterpretationBaseline Correction and Data Processing Techniques, Quantitative Analysis: Extracting Meaningful Values from Curves, Statistical Validation and Assessing Data Quality
- Chapter 9: Troubleshooting and Quality AssuranceIdentifying and Correcting Common Artifacts and Errors, Ensuring Reproducibility and Method Validation, Quality Control Strategies and Reference Standards
- Chapter 10: Advanced Topics and Emerging TechniquesCoupled Thermal Analysis: Combining Multiple Methods, Kinetic Analysis and Reaction Rate Determination, Emerging Techniques and Future Directions in Thermal Analysis
- ConclusionKey Takeaways and Moving Forward, Continuing Your Thermal Analysis Journey
- Appendix: Quick Reference GuidesCalibration Checklist and Standards, Troubleshooting Decision Tree, Glossary of Thermal Analysis Terms
Introduction
A pharmaceutical company spends months developing a new drug formulation, only to discover during stability testing that the active ingredient converts to a less effective crystalline form at room temperature. A polymer manufacturer ships a batch of material that fails quality control because its glass transition temperature shifted by just eight degrees. A biochemist runs binding assay after binding assay, unable to explain why two proteins interact so strongly under one buffer condition and barely at all under another. In each case, the answer was sitting in the thermal behavior of the material, waiting to be measured. Thermal analysis and calorimetry are the tools that make those answers visible.
Heat is not just a byproduct of chemical processes. It is a direct signal of what is happening at the molecular level. When a material melts, crystallizes, decomposes, or binds to another molecule, energy is exchanged in ways that are precise, reproducible, and deeply informative. Techniques like Differential Scanning Calorimetry, Thermogravimetric Analysis, and Isothermal Titration Calorimetry are designed to capture those energy exchanges with high sensitivity and translate them into quantitative data about material properties, reaction thermodynamics, and molecular interactions.
Despite their power, these techniques are frequently misused. Samples are prepared carelessly. Instruments are run without proper calibration. Data is interpreted without understanding what the curves actually represent. The result is a lab full of numbers that look precise but mean very little. This book exists to close that gap. The goal is not to turn you into an instrument engineer or a theoretical thermodynamicist. The goal is to give you the practical understanding you need to design good experiments, collect reliable data, and draw conclusions you can defend.
The chapters ahead move from foundational principles through specific techniques and into the practical details of data analysis, troubleshooting, and advanced methods. Each section is built around what you actually need to know to work confidently at the bench. Whether you are running your first Differential Scanning Calorimetry experiment or trying to understand why your Thermogravimetric Analysis curves are inconsistent from run to run, you will find concrete guidance here rather than abstract theory.
Why Thermal Analysis Matters in Modern Chemistry
Most analytical techniques tell you what is in a sample. Spectroscopy identifies functional groups. Chromatography separates and quantifies components. Mass spectrometry reveals molecular weights. Thermal analysis does something different: it tells you how a material behaves as a function of temperature, and that behavior encodes information about structure, stability, purity, and reactivity that no other single class of techniques can provide as directly.
Consider polymorphism, the ability of a solid material to exist in more than one crystalline form. In the pharmaceutical industry, different polymorphs of the same drug molecule can have dramatically different solubility, bioavailability, and shelf life. Differential Scanning Calorimetry can distinguish polymorphs by their distinct melting temperatures and heat of fusion values, often in a single 20-minute experiment. Identifying the correct polymorph before scale-up manufacturing is not a minor detail; it is a regulatory and safety requirement.[1]
In materials science, the glass transition temperature of a polymer determines the temperature range over which it can be used safely. A polymer intended for automotive under-hood applications needs a glass transition temperature well above the operating temperature of the engine compartment. A packaging film needs to remain flexible at refrigerator temperatures. Differential Scanning Calorimetry measures these transitions directly, giving engineers the data they need to select or design the right material for the right application.
Thermogravimetric Analysis addresses a different but equally important set of questions. When does a material start to decompose? How much moisture does it absorb from the atmosphere? What fraction of a composite material is filler versus polymer matrix? These questions matter in industries ranging from aerospace composites to food science to battery electrode development. The decomposition temperature of a material is not just an academic curiosity; it defines the upper boundary of safe processing and storage conditions.
Isothermal Titration Calorimetry occupies a unique position in biochemistry and drug discovery. It is the only technique that can simultaneously measure the binding constant, binding stoichiometry, and enthalpy of binding for a molecular interaction in a single experiment, without requiring labels, immobilization, or optical signals.[2] That combination of thermodynamic parameters gives a complete picture of why two molecules interact, not just whether they do.
Thermal analysis also serves as a quality control workhorse. In manufacturing environments, routine Differential Scanning Calorimetry or Thermogravimetric Analysis runs on incoming raw materials can catch batch-to-batch variability before it propagates into finished products. A shift in the onset temperature of a polymer's melting peak, or an unexpected mass-loss event in a Thermogravimetric Analysis curve, can flag a contaminated or degraded lot before it causes a production failure. This kind of early detection is far cheaper than downstream rework or product recalls.
The breadth of applications is one reason thermal analysis has become a standard part of the analytical toolkit across chemistry, materials science, biology, and engineering. The other reason is accessibility. Modern instruments are reliable, relatively straightforward to operate, and capable of producing publication-quality data with modest sample quantities, often just a few milligrams. That combination of informational richness and practical accessibility makes thermal analysis worth understanding deeply.
Thermal analysis does not replace other analytical methods. It complements them. A Differential Scanning Calorimetry curve that shows an unexpected exotherm tells you something is happening, but it takes spectroscopic or chromatographic follow-up to tell you exactly what. The most powerful analytical workflows combine thermal data with structural and compositional information from other techniques.
Understanding why thermal analysis matters is the first step. The second step is understanding what each technique actually measures and how to choose the right one for your question. That is where the next section begins.
What This Book Covers and How to Use It
This book is organized to take you from foundational understanding through practical execution and into advanced applications. The structure is deliberate. Skipping straight to the technique-specific chapters is tempting, but the chapters on thermodynamic principles and instrument calibration contain information that will save you significant time and frustration later. A misunderstood baseline or an uncalibrated temperature axis can invalidate an entire dataset, and those problems are much easier to prevent than to diagnose after the fact.
The early chapters establish the thermodynamic and heat-flow principles that underpin every measurement you will make. Enthalpy, entropy, Gibbs free energy, and heat capacity are not just textbook concepts here. They are the quantities your instruments are actually measuring, and understanding them changes how you read a curve. The chapter on instrument components and calibration follows directly, because knowing what your instrument is doing mechanically is inseparable from knowing how to trust its output.
The technique-specific chapters on Differential Scanning Calorimetry, Thermogravimetric Analysis, and Isothermal Titration Calorimetry each follow the same structure. First, the experimental methodology and best practices. Second, how to interpret the data those experiments produce. Third, real-world application examples drawn from polymers, pharmaceuticals, materials science, and biochemistry. This structure means you can use each chapter as a standalone reference when you are preparing for a specific type of experiment.
The data analysis chapter covers baseline correction, peak integration, and statistical validation in a way that applies across all three major techniques. These are skills that transfer. Once you understand how to draw a reliable baseline on a Differential Scanning Calorimetry curve, the same logic applies to Thermogravimetric Analysis data. The troubleshooting chapter is organized around symptoms rather than techniques, so you can look up a problem by what you observe rather than by which instrument you are using.
The advanced topics chapter covers coupled techniques like TGA-MS and TGA-FTIR, kinetic analysis methods including the Kissinger method for determining activation energy, and emerging directions in the field. These topics assume familiarity with the core techniques, so they are placed at the end intentionally. The appendix provides quick-reference materials including calibration checklists, a troubleshooting decision tree, and a glossary of canonical terms.
Here is a practical guide to navigating the book based on your starting point:
- If you are new to thermal analysis: Read the thermodynamic principles chapter and the instrument calibration chapter before anything else. Then read the technique overview chapter to orient yourself before diving into the technique-specific chapters.
- If you are preparing for a specific experiment: Go directly to the relevant technique chapter (Differential Scanning Calorimetry, Thermogravimetric Analysis, or Isothermal Titration Calorimetry), then cross-reference the sample preparation chapter and the data analysis chapter.
- If you are troubleshooting inconsistent results: Start with the troubleshooting chapter, then refer back to the calibration and sample preparation chapters to address root causes.
- If you are interpreting data you have already collected: The data analysis chapter and the interpretation sections within each technique chapter are your primary resources.
One important note about terminology: this book uses the canonical names for all techniques and parameters consistently throughout. Differential Scanning Calorimetry is never abbreviated to just "scanning calorimetry." The glass transition temperature is always referred to by that full name on first use in each chapter. This consistency is intentional. In the literature, inconsistent terminology is a genuine source of confusion, and building precise language habits early makes reading primary literature much easier.
The examples throughout the book are drawn from real material classes and real experimental scenarios. When a Differential Scanning Calorimetry curve shows a double melting peak in a semicrystalline polymer, the explanation connects to what is actually happening in the material's crystalline structure. When a Thermogravimetric Analysis curve shows a two-step mass loss, the interpretation connects to specific chemical events. Concrete examples are not decoration here; they are the primary vehicle for building the pattern recognition that makes you a competent analyst.
Finally, this book does not assume you have access to any specific instrument brand or model. The principles and practices described apply across the major commercial platforms. Where instrument-specific details matter, they are noted as general categories (for example, heat-flux DSC versus power-compensation DSC) rather than as brand-specific instructions. Your instrument's manual is the authoritative source for its specific operating procedures; this book gives you the conceptual framework to use that manual intelligently.
The Thermal Analysis Landscape: Techniques and Applications
Thermal analysis is not a single technique. It is a family of methods, each designed to measure a different property of a material as a function of temperature or time. Choosing the wrong technique for your question is one of the most common mistakes in the field, and it usually results in data that is technically correct but scientifically useless. A brief map of the landscape helps you make that choice deliberately rather than by default.
Differential Scanning Calorimetry measures heat flow into or out of a sample as its temperature changes. It is the technique of choice for detecting and quantifying phase transitions: melting, crystallization, the glass transition temperature, and solid-solid transitions. It also measures heat capacity and can detect exothermic events like curing reactions or oxidative degradation. The output is a curve of heat flow versus temperature, and the area under a peak gives the enthalpy of the transition. Differential Scanning Calorimetry is probably the most widely used thermal analysis technique across industries, largely because it answers so many different questions with a single measurement.
Thermogravimetric Analysis measures mass change as a function of temperature or time. It cannot detect transitions that do not involve mass change, so it will not show you a glass transition or a solid-solid phase change. What it does show is any event that involves loss or gain of mass: evaporation of moisture or solvents, decomposition of organic components, oxidation, and reduction reactions. The derivative thermogravimetry curve, which plots the rate of mass change rather than the cumulative mass change, is particularly useful for resolving overlapping events and identifying the onset temperature of each step precisely.
Isothermal Titration Calorimetry operates on a fundamentally different principle from the other two. Rather than scanning temperature, it holds temperature constant and measures the heat released or absorbed as one solution is titrated into another. This makes it uniquely suited to studying molecular interactions in solution: protein-ligand binding, enzyme-substrate interactions, host-guest chemistry, and surfactant micellization. The shape of the titration curve encodes the binding constant, the binding stoichiometry, and the enthalpy of binding, from which entropy and Gibbs free energy can be calculated.
Beyond these three core techniques, the thermal analysis landscape includes several other methods with important specialized applications:
- Dynamic Mechanical Analysis (DMA): Measures the mechanical response of a material (stiffness and damping) as a function of temperature and frequency. Particularly sensitive to the glass transition temperature in polymers, often more so than Differential Scanning Calorimetry.
- Thermomechanical Analysis (TMA): Measures dimensional changes (expansion, contraction, softening) as a function of temperature. Used for coefficient of thermal expansion measurements and softening point determination.
- TGA-MS and TGA-FTIR: Coupled techniques that combine Thermogravimetric Analysis with mass spectrometry or Fourier-transform infrared spectroscopy to identify the gases evolved during mass-loss events. These hyphenated methods answer not just "how much mass was lost" but "what was it."
Selecting the right technique starts with a clear statement of your scientific question. The following framework helps:
- Are you studying a phase transition or energy change in a solid or liquid? Differential Scanning Calorimetry is almost always the starting point.
- Are you studying thermal stability, decomposition, or composition? Thermogravimetric Analysis is the primary tool, often combined with Differential Scanning Calorimetry for a more complete picture.
- Are you studying a molecular interaction in solution? Isothermal Titration Calorimetry is the method of choice if you need thermodynamic parameters.
- Are you studying mechanical properties or dimensional changes? Dynamic Mechanical Analysis or Thermomechanical Analysis will give you information that Differential Scanning Calorimetry cannot.
- Do you need to identify evolved gases? A coupled TGA-MS or TGA-FTIR setup is necessary.
In practice, many research questions benefit from combining two or more techniques. A complete characterization of a pharmaceutical solid, for example, might involve Differential Scanning Calorimetry to identify polymorphic transitions and melting behavior, Thermogravimetric Analysis to quantify residual solvent and assess thermal stability, and Dynamic Mechanical Analysis to characterize the mechanical properties of a tablet formulation. Each technique contributes a layer of information that the others cannot provide.
The temperature ramp rate is a parameter that affects results across all scanning techniques, and it is worth flagging here even before the detailed chapters. Faster ramp rates improve sensitivity to small transitions but can cause thermal lag, where the sample temperature lags behind the programmed temperature. Slower ramp rates improve resolution between closely spaced events but reduce sensitivity. There is no universally correct ramp rate; the right choice depends on what you are trying to resolve and how much sample you have. This trade-off will appear repeatedly throughout the book.
The purge gas environment is another cross-cutting parameter. Running a Thermogravimetric Analysis experiment in nitrogen versus air produces fundamentally different results for materials that oxidize. Running a Differential Scanning Calorimetry experiment in an inert atmosphere prevents oxidative artifacts that could be mistaken for real thermal events. The choice of atmosphere is not a minor experimental detail; it is part of the experimental design and must be reported alongside the results.
One of the most important conceptual shifts in becoming a competent thermal analyst is moving from thinking about instruments to thinking about phenomena. The instrument is a measurement device. The phenomenon is what is actually happening in your sample. A Differential Scanning Calorimetry curve does not show you a "melting peak"; it shows you the heat flow associated with the disruption of a crystalline lattice as thermal energy overcomes the intermolecular forces holding it together. That distinction sounds subtle, but it changes how you design experiments, how you interpret anomalies, and how you communicate your results. The chapters ahead are built around that phenomenon-first perspective, and it will serve you well beyond the specific techniques covered here.
This is the end of the free sample. The full book has 10 chapters.
Want this book written for you?
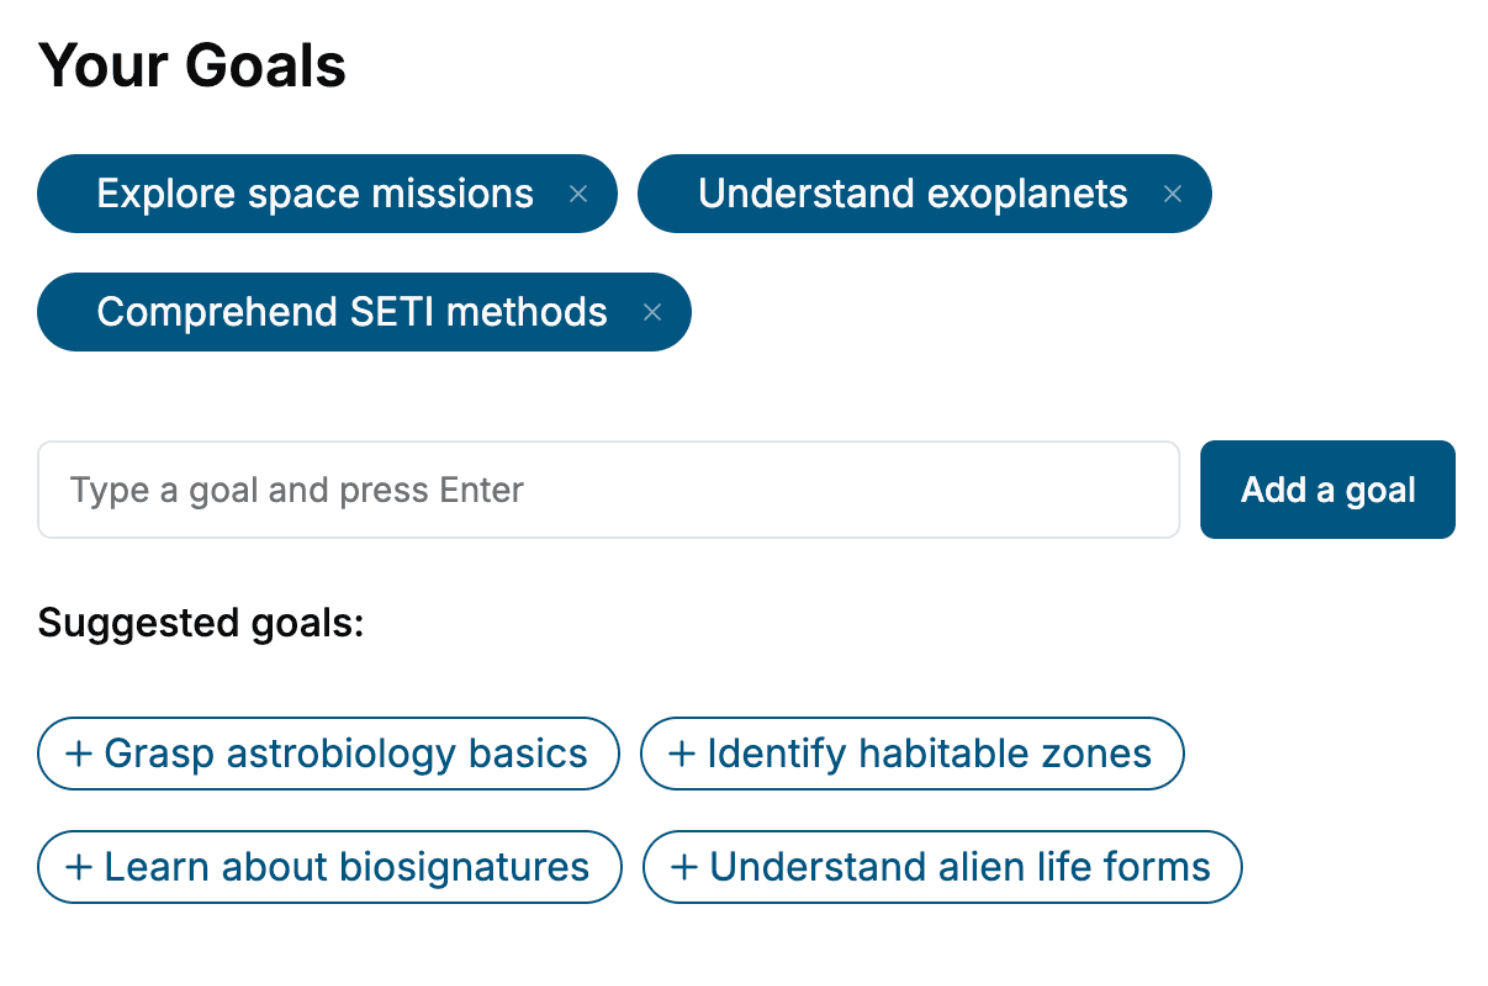
Tell us your goals and background, and get your own version of this book, tailored by AI to you.


Benefits of AI-tailored books
- Read one book, not ten:
- all the Analytical Chemistry knowledge you need, gathered into a single book.
- Save days of learning:
- tell us your goals, choose your topics, and the whole book is built around them.
- Learn effortlessly:
- Analytical Chemistry book written for your specific background and expertise.
- Understand at a glance:
- includes charts, tables, timelines, checklists, decision trees, and more.
- Stay current:
- written the day you order it, not years ago.
- Trust what you read:
- every book is checked for accuracy, with real research when your subject needs it.
Create your unique book in 3 steps
- 1. Select your focus
Select the focus of your Analytical Chemistry book and share your background
- 2. Personalize your book
Specify your goals and choose sub-topics to include
- 3. Get your tailored book
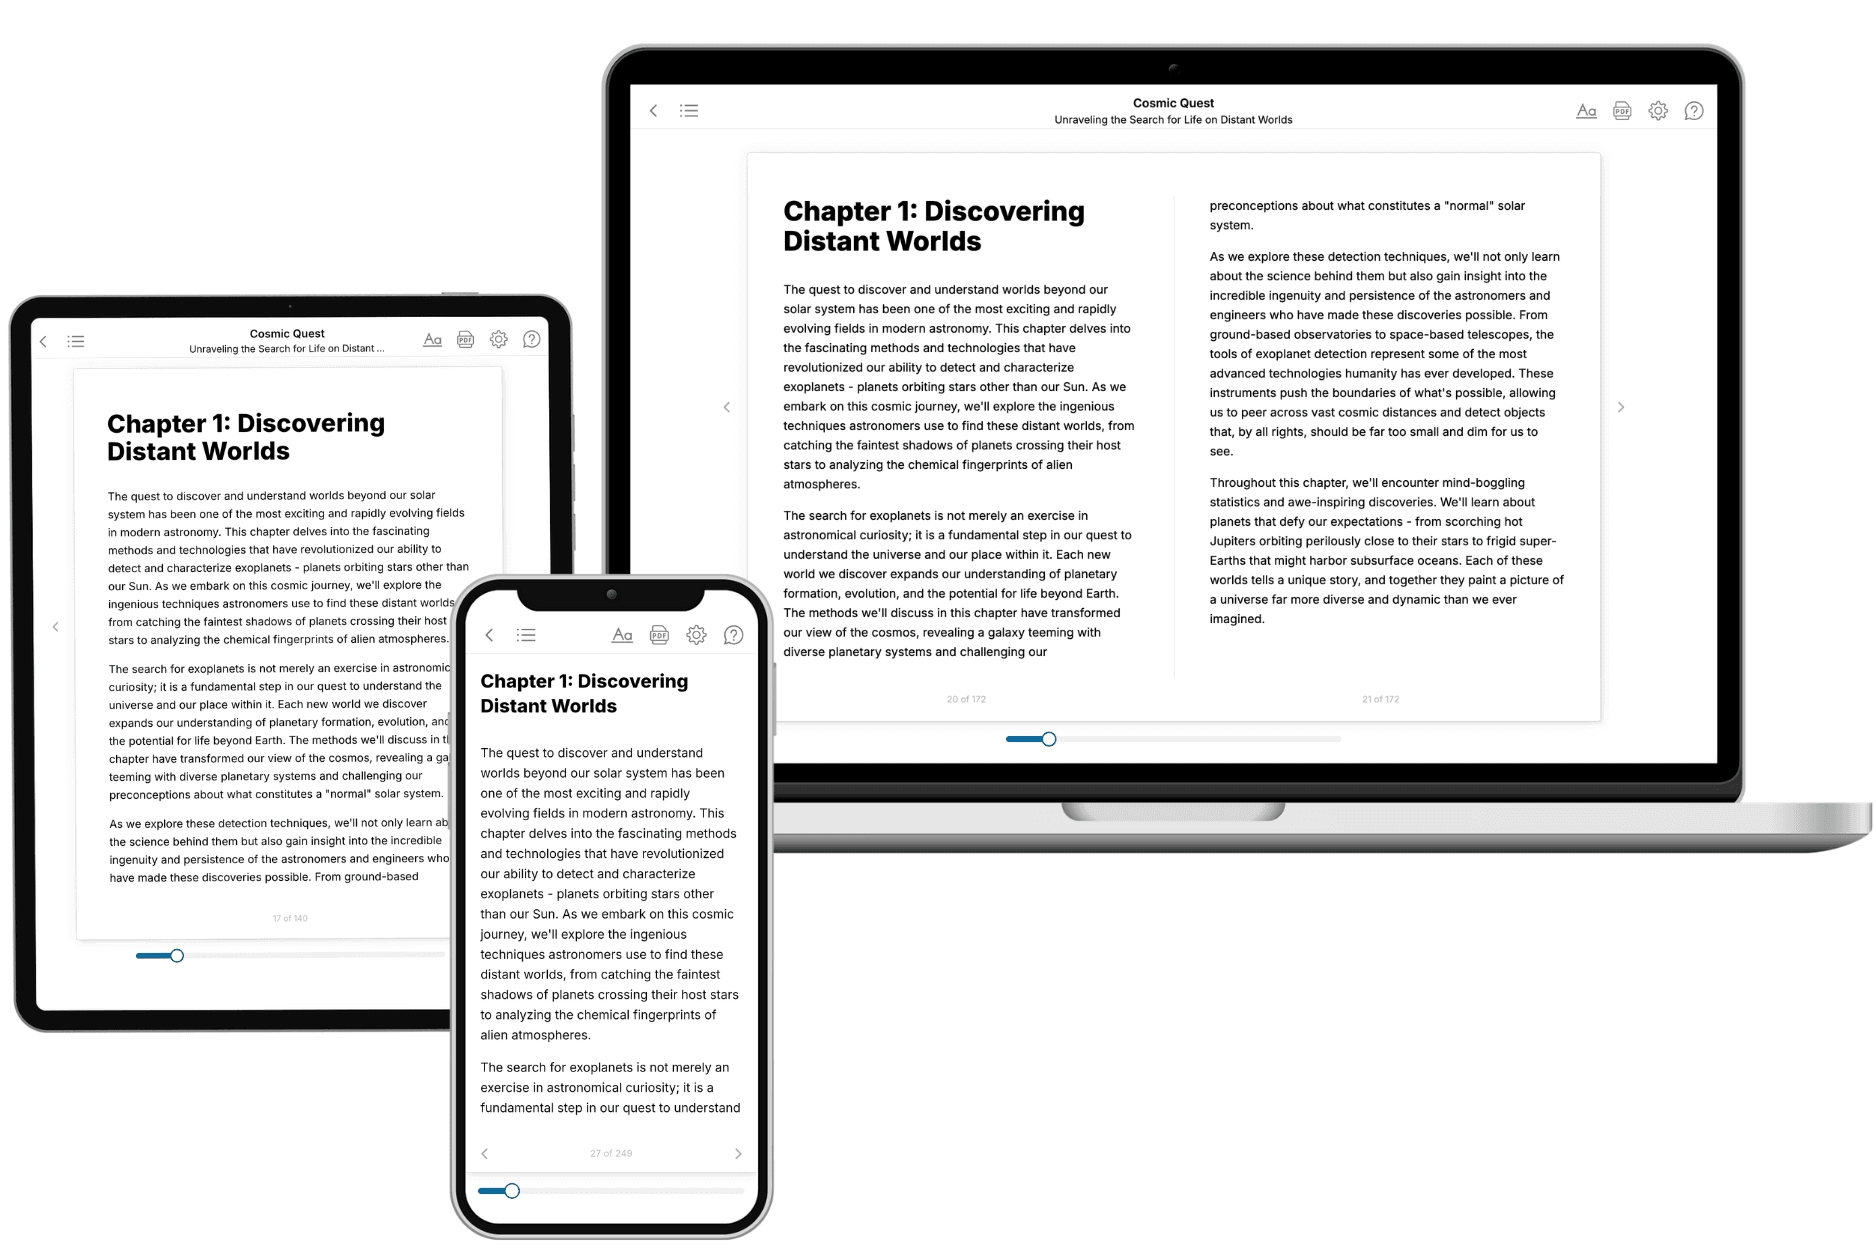
Your book is ready in 10 minutes. Read it online, download as EPUB or PDF, or send to Kindle.

Frequently asked questions
- What is TailoredRead?
TailoredRead creates complete, full-length nonfiction ebooks, written specifically for you. Tell us what you want to learn and why, and TailoredRead writes you a complete ebook on it, with charts, tables, and diagrams throughout. Read it online, on Kindle, or on any e-reader, or download it as a PDF or EPUB. Every book is written fresh the day you order it.
- How is the book tailored to me?
Before anything is written, you answer a few short questions about your goals, your background, and the topics you care about. Your book is then planned around your answers: written at your level, focused on your goals, and covering the topics you chose, instead of the one-size-fits-all book a store sells everyone.
- Will it read like generic AI content?
No. Your book isn't a chat transcript: it's planned chapter by chapter before a single word is written, told in a clear book voice, and explains ideas visually with charts, tables, and diagrams. After writing, every book goes through an editorial pass that polishes chapters so the book reads consistent from start to finish. Judge for yourself: browse thousands of sample books on our Explore Books page.
- How accurate is the content?
Our AI first checks whether your subject needs live research. Niche and fast-moving subjects are researched before writing, and the book plan and chapters are grounded in what it finds. After writing, every book goes through a quality pass that checks its facts and consistency, and researched books list their sources in a Notes section at the back.
- How long is the book?
You choose the length: Comprehensive (250-300 pages), Detailed (150-200 pages), Essential (70-100 pages), or Short (30-50 pages).
- Does the book include visuals?
Yes. Every book includes charts, tables, and diagrams: timelines, checklists, step-by-step guides, decision trees, comparison tables, matrices, and bar charts. A typical book includes dozens of these visual elements.
- Can I read it on Kindle? What formats can I download?
Yes. Every book can be read in our online reader or downloaded as a PDF or EPUB. The EPUB can be opened with Kindle, Apple Books, Kobo, and any e-reader. The Commercial and Author licenses also include an editable Word (DOCX) and Markdown download.
- How much does it cost?
About the price of a regular ebook. The exact price depends on your book's length and complexity, from $2 for the shortest books to $35 for the most comprehensive, and it's shown when you review your book, before you commit to anything. Each book is a one-time purchase, yours to keep, no subscription. Licenses that let you share, teach, or publish your book range from $35.99 to $49.99.
- Can I preview the book before purchasing?
Before you pay, you'll see what your book will cover: the title, a detailed description, the estimated length, and the complete chapter-by-chapter table of contents, so you know what you're getting before you decide. The full text itself is written after you purchase.
- How long does it take to create a book?
About 10 minutes. You can start reading the opening chapters while the rest is still being written.