Time Series Mastery
From Data Patterns to Predictive Insights
What patterns are hiding in your data that you're currently missing?
222 pages10 chaptersFeb 17, 2026Time series
About this book
Time series analysis reveals the temporal dynamics that shape everything from stock prices to weather patterns to business metrics. This book bridges the gap between statistical theory and practical application, showing you how to identify meaningful patterns in sequential data and build models that actually predict the future. You'll move beyond basic statistics to master the specialized techniques that professionals use to forecast trends, detect anomalies, and understand how past behavior influences what comes next. Whether you're analyzing financial data, operational metrics, or scientific measurements, you'll gain the confidence to select appropriate models, validate your results, and communicate findings that drive real decisions.
Table of contents
- IntroductionWhy Time Matters in Data Analysis, What You'll Learn in This Book, How to Use This Book EffectivelyRead below
- Chapter 1: Foundations of Time Series DataDefining Time Series and Its Characteristics, Understanding Temporal Dependence, Types of Time Series Data
- Chapter 2: Stationarity and TransformationsWhat Is Stationarity and Why It Matters, Testing for Stationarity, Achieving Stationarity Through Differencing, Data Transformations and Stabilization
- Chapter 3: Autocorrelation and Partial AutocorrelationUnderstanding Autocorrelation Functions, Partial Autocorrelation and Its Interpretation, Reading and Interpreting Correlograms
- Chapter 4: Seasonal DecompositionUnderstanding Trend, Seasonal, and Residual Components, Classical and Modern Decomposition Methods, Interpreting and Using Decomposed Components
- Chapter 5: ARIMA Models ExplainedARIMA Fundamentals: AR, I, and MA Components, Selecting ARIMA Parameters (p, d, q), Fitting and Evaluating ARIMA Models, Seasonal ARIMA (SARIMA) Models
- Chapter 6: Exponential Smoothing MethodsSimple Exponential Smoothing, Holt-Winters and Advanced Smoothing, Choosing Between Smoothing Approaches
- Chapter 7: Forecasting and PredictionPrinciples of Accurate Forecasting, Confidence Intervals and Uncertainty Quantification, Evaluating Forecast Accuracy
- Chapter 8: Model Validation and DiagnosticsTrain-Test Splits and Cross-Validation, Residual Analysis and Diagnostic Checks, Preventing Overfitting in Time Series Models
- Chapter 9: Advanced Topics and Modern ApproachesState-Space Models and Kalman Filtering, Multivariate Time Series Analysis, Machine Learning Approaches to Time Series
- Chapter 10: Real-World Applications and Case StudiesFinancial Data and Stock Price Forecasting, Demand Planning and Inventory Management, Anomaly Detection in Temporal Data
- ConclusionKey Takeaways and Next Steps, Continuing Your Time Series Journey
- Glossary
- Further Reading and Resources
Introduction
Every dataset tells a story, but time series data tells a story with a plot. Unlike static snapshots that capture a single moment, temporal data reveals how systems evolve, how patterns emerge, and how past events shape future outcomes. When you analyze sales figures, stock prices, temperature readings, or website traffic, you're not just looking at numbers—you're examining the fingerprints of dynamic processes that unfold across time. The challenge lies in extracting meaningful insights from these sequences, distinguishing genuine patterns from random noise, and building models that can reliably predict what comes next. This book provides you with the analytical framework and practical techniques to transform temporal data into actionable intelligence.
Time series analysis occupies a unique position in the data science landscape. While traditional statistical methods assume independence between observations, time series techniques explicitly account for the fact that today's value depends on yesterday's, and that patterns repeat in predictable cycles. This temporal dependence creates both opportunities and challenges. On one hand, it allows you to leverage historical patterns to forecast future behavior with remarkable accuracy. On the other hand, it requires specialized methods that respect the sequential nature of your data. Applying standard regression or classification techniques to time series data often produces misleading results because these methods ignore the autocorrelation structure that defines temporal relationships.
The practical applications of time series analysis span virtually every industry and domain. Financial analysts use it to forecast stock prices and manage risk. Supply chain managers rely on it to predict demand and optimize inventory levels. Healthcare researchers apply it to track disease progression and predict patient outcomes. Climate scientists employ it to understand long-term weather patterns and project future conditions. Marketing teams use it to anticipate customer behavior and plan campaigns. Regardless of your specific field, if you work with data that changes over time, mastering these techniques will fundamentally enhance your analytical capabilities and decision-making effectiveness.
This book bridges the gap between theoretical understanding and practical implementation. You'll learn not just the mathematical foundations of time series methods, but also how to apply them to real-world problems, interpret the results correctly, and communicate your findings effectively. Each chapter builds progressively on previous concepts, starting with fundamental principles and advancing to sophisticated modeling techniques. Throughout, you'll encounter concrete examples, diagnostic procedures, and validation strategies that ensure your models are both accurate and reliable. By the end, you'll possess a comprehensive toolkit for tackling temporal data challenges with confidence and precision.
Why Time Matters in Data Analysis
Time introduces a dimension to data that fundamentally changes how you must approach analysis. When observations are collected sequentially, they carry information not just in their individual values but in their ordering and spacing. A sales figure of $50,000 means something entirely different if it follows three months of decline versus three months of growth. This temporal context creates dependencies between observations that violate the independence assumption underlying most classical statistical methods. Ignoring these dependencies doesn't just reduce your analytical power—it can lead to completely incorrect conclusions and unreliable predictions.
Consider the difference between analyzing customer satisfaction scores collected randomly versus tracking the same scores over time. The random sample tells you about average satisfaction levels and demographic patterns. The time series reveals trends, seasonal fluctuations, and the impact of specific interventions. You can see whether satisfaction is improving or declining, identify periods of unusual volatility, and detect the delayed effects of policy changes. This temporal perspective transforms descriptive statistics into a dynamic narrative that explains not just what is happening but how and potentially why it's happening. The sequential nature of the data becomes a feature rather than a complication.
Temporal dependence manifests in several distinct forms that require different analytical approaches:
- Trend: Long-term directional movement indicating systematic increase or decrease over time
- Seasonality: Regular patterns that repeat at fixed intervals, such as daily, weekly, or annual cycles
- Autocorrelation: The relationship between an observation and its own past values at various lags
- Volatility clustering: Periods of high variability followed by periods of low variability
- Structural breaks: Sudden changes in the underlying data-generating process due to external events
The predictive power of time series analysis stems from a fundamental principle: the past contains information about the future. This doesn't mean the future is predetermined or perfectly predictable, but rather that historical patterns often persist and can be extrapolated forward with quantifiable uncertainty. When you observe that retail sales consistently spike in December, that stock volatility increases during earnings announcements, or that website traffic follows weekly patterns, you're identifying regularities that enable forecasting. The key is distinguishing genuine patterns from random fluctuations and building models that capture the former while accounting for the latter.
Time series methods also excel at anomaly detection—identifying observations that deviate significantly from expected patterns. A sudden spike in server response times, an unexpected drop in daily transactions, or an unusual pattern in sensor readings all signal potential problems that require investigation. By establishing what "normal" behavior looks like over time, you create a baseline against which anomalies become immediately apparent. This capability is invaluable for quality control, fraud detection, system monitoring, and early warning systems across countless applications. The temporal context transforms outlier detection from a static threshold problem into a dynamic pattern recognition challenge.
Perhaps most importantly, time series analysis forces you to think carefully about causality and temporal ordering. When you observe that variable A changes before variable B, you have evidence (though not proof) of a potential causal relationship. This temporal precedence is a necessary condition for causation—effects cannot precede their causes. While correlation in cross-sectional data leaves causality ambiguous, time series data provides directional information that helps you distinguish leading indicators from lagging effects. This insight is crucial for understanding system dynamics and designing effective interventions.
The business value of time series analysis is substantial and measurable. Organizations that accurately forecast demand reduce inventory costs while maintaining service levels. Financial institutions that model volatility effectively manage risk and optimize portfolios. Manufacturers that predict equipment failures schedule maintenance proactively rather than reactively. Energy companies that forecast consumption patterns optimize generation and distribution. In each case, the ability to anticipate future conditions based on historical patterns translates directly into competitive advantage, cost savings, and improved decision-making. The return on investment in time series capabilities often exceeds that of other analytical approaches precisely because temporal data is so ubiquitous in operational contexts.
What You'll Learn in This Book
This book provides a comprehensive journey through time series analysis, from foundational concepts to advanced modeling techniques. You'll begin by understanding what makes time series data unique and how temporal dependence shapes analytical requirements. The early chapters establish the conceptual framework you need to think correctly about sequential data, including the critical concept of stationarity—the property that determines whether standard time series models can be applied directly or whether transformations are required first. You'll learn to recognize non-stationary patterns and apply appropriate transformations to achieve the stable statistical properties that modeling requires.
The core of the book focuses on the diagnostic tools and modeling frameworks that form the foundation of professional time series analysis. You'll master autocorrelation functions (ACF) and partial autocorrelation functions (PACF), learning to read these diagnostic plots as roadmaps that guide you toward appropriate model structures. These tools reveal the temporal dependencies in your data and indicate which modeling approaches are likely to succeed. You'll understand how to decompose time series into trend, seasonal, and residual components, separating signal from noise and gaining insight into each factor's contribution to overall patterns.
The ARIMA modeling framework receives extensive coverage because it represents the workhorse methodology for time series forecasting. You'll learn what each component means and how to select appropriate parameters:
- AR (Autoregressive): How current values depend on past values
- I (Integrated): The degree of differencing needed to achieve stationarity
- MA (Moving Average): How current values depend on past forecast errors
- Seasonal components: Extensions that capture repeating patterns at fixed intervals
Beyond ARIMA, you'll explore alternative approaches that offer distinct advantages for specific scenarios. Exponential smoothing methods provide intuitive forecasting techniques that weight recent observations more heavily than distant ones, with extensions that handle trend and seasonality elegantly. These methods often perform comparably to ARIMA while requiring less technical expertise to implement and interpret. You'll learn when to choose smoothing approaches over ARIMA and how to optimize smoothing parameters for your specific data characteristics. The book also introduces state-space models, which provide a flexible framework for handling complex temporal dynamics and missing data.
Forecasting receives dedicated attention because prediction is often the ultimate goal of time series analysis. You'll learn the principles of accurate forecasting, including how to generate point forecasts and quantify uncertainty through confidence intervals. More importantly, you'll master forecast evaluation techniques that tell you whether your predictions are actually reliable. This includes metrics like mean absolute error (MAE), root mean squared error (RMSE), and mean absolute percentage error (MAPE), along with guidance on which metrics are appropriate for different contexts. You'll understand the critical distinction between in-sample fit and out-of-sample forecast accuracy.
Model validation and diagnostics form a crucial thread throughout the book. You'll learn to implement proper train-test splits that respect temporal ordering, avoiding the data leakage that occurs when future information contaminates model training. Residual analysis techniques help you verify that your model has captured all systematic patterns, leaving only random noise. You'll understand how to detect and prevent overfitting, ensuring your models generalize to new data rather than merely memorizing historical patterns. These validation practices separate professional-grade analysis from amateur efforts that produce impressive-looking but ultimately unreliable results.
The later chapters introduce advanced topics that extend your capabilities beyond univariate forecasting. You'll explore multivariate time series analysis, learning to model multiple related series simultaneously and capture cross-series dependencies. The book covers modern machine learning approaches to time series, including how to apply algorithms like random forests and neural networks to temporal data while respecting its sequential nature. You'll understand the strengths and limitations of these methods compared to traditional statistical approaches, enabling you to choose the right tool for each situation.
Throughout the book, real-world applications and case studies ground theoretical concepts in practical contexts. You'll see how time series methods apply to financial forecasting, demand planning, anomaly detection, and other common business problems. Each application demonstrates not just the technical implementation but also the domain-specific considerations that affect model selection and interpretation. These examples provide templates you can adapt to your own analytical challenges, accelerating your path from learning to practical application. By the end, you'll possess both the theoretical understanding and practical skills to tackle time series problems confidently across diverse domains.
How to Use This Book Effectively
This book is designed for progressive learning, with each chapter building on concepts introduced previously. While you might be tempted to jump directly to advanced topics like ARIMA modeling or forecasting, resist this urge initially. The foundational chapters on stationarity, autocorrelation, and decomposition provide essential conceptual frameworks that make later material much easier to understand and apply correctly. Even if you have some prior exposure to time series analysis, reviewing these fundamentals ensures you have a solid base and helps you identify any gaps in your understanding. The investment in working through early chapters systematically pays substantial dividends when you encounter more complex material.
Each chapter follows a consistent structure designed to facilitate learning and retention. Concepts are introduced with clear definitions and intuitive explanations before diving into technical details. Practical examples illustrate how abstract ideas manifest in real data, helping you develop the pattern recognition skills essential for effective analysis. Diagnostic procedures and validation techniques are integrated throughout rather than relegated to separate sections, emphasizing that checking your work is an integral part of the analytical process, not an afterthought. This structure mirrors how you should approach actual time series problems: understand the concept, apply it to your data, validate the results, and iterate as needed.
To maximize your learning, adopt an active reading approach rather than passive consumption. When you encounter a new technique or diagnostic test, pause and consider how it applies to data you've worked with previously. If possible, replicate the examples using your own software environment, whether that's R, Python, or another platform. The book focuses on concepts and interpretation rather than specific software implementations, making the material applicable regardless of your technical stack. This platform-agnostic approach ensures the knowledge remains relevant even as specific tools evolve, while giving you flexibility to work in your preferred environment.
Pay particular attention to the diagnostic procedures and validation techniques presented throughout the book. These practices distinguish reliable analysis from superficial curve-fitting:
- Visual inspection: Always plot your data and model results before trusting numerical summaries
- Residual analysis: Check that model residuals are random and show no systematic patterns
- Out-of-sample testing: Validate forecasts on data not used for model training
- Sensitivity analysis: Test how results change with different model specifications
- Domain validation: Ensure results make sense given your subject matter knowledge
The book includes numerous examples and case studies, but your learning will deepen significantly if you apply the techniques to your own data. Identify a time series dataset relevant to your work or interests—perhaps sales data, stock prices, weather measurements, or web analytics. As you progress through the chapters, apply each new technique to this dataset. You'll encounter challenges and ambiguities that aren't present in textbook examples, forcing you to develop judgment and problem-solving skills. This hands-on practice transforms theoretical knowledge into practical capability much more effectively than passive reading alone.
When you encounter difficult concepts, don't get discouraged or stuck. Time series analysis involves some mathematical sophistication, but you don't need to master every technical detail to apply the methods effectively. Focus first on understanding what each technique does and when to use it. The deeper mathematical why can come later as your intuition develops. If a particular section proves challenging, mark it and continue forward. Often, later material provides additional context that makes earlier concepts clearer upon review. The book is designed to support multiple passes, with each reading revealing additional layers of understanding.
Use the chapter summaries and key takeaways as review tools and quick references. After completing a chapter, test your understanding by explaining the main concepts to someone else or writing a brief summary in your own words. This active recall strengthens retention and reveals gaps in understanding. The glossary provides quick definitions of technical terms, while the further reading section points you toward resources for deeper exploration of specific topics. These supplementary materials support both initial learning and ongoing reference as you apply time series techniques in your work.
Finally, remember that mastery comes through practice and iteration. Your first attempts at time series modeling will likely involve missteps and suboptimal choices. This is normal and expected. Each analysis teaches you something about data behavior, model characteristics, and diagnostic interpretation. Over time, you'll develop intuition about which approaches work well for different data types and how to troubleshoot problems efficiently. The goal isn't perfection on your first try but rather steady improvement in your analytical judgment and technical execution. Embrace the learning process, stay curious about why things work the way they do, and maintain a healthy skepticism about your results until they've been thoroughly validated. This mindset, combined with the techniques presented in this book, will serve you well throughout your time series analysis journey.
This is the end of the free sample. The full book has 10 chapters.
Want this book written for you?
Tell us your goals and background, and get your own version of this book, tailored by AI to you.


Benefits of AI-tailored books
- Read one book, not ten:
- all the Time series knowledge you need, gathered into a single book.
- Save days of learning:
- tell us your goals, choose your topics, and the whole book is built around them.
- Learn effortlessly:
- Time series book written for your specific background and expertise.
- Understand at a glance:
- includes charts, tables, timelines, checklists, decision trees, and more.
- Stay current:
- written the day you order it, not years ago.
- Trust what you read:
- every book is checked for accuracy, with real research when your subject needs it.
Create your unique book in 3 steps
- 1. Select your focus
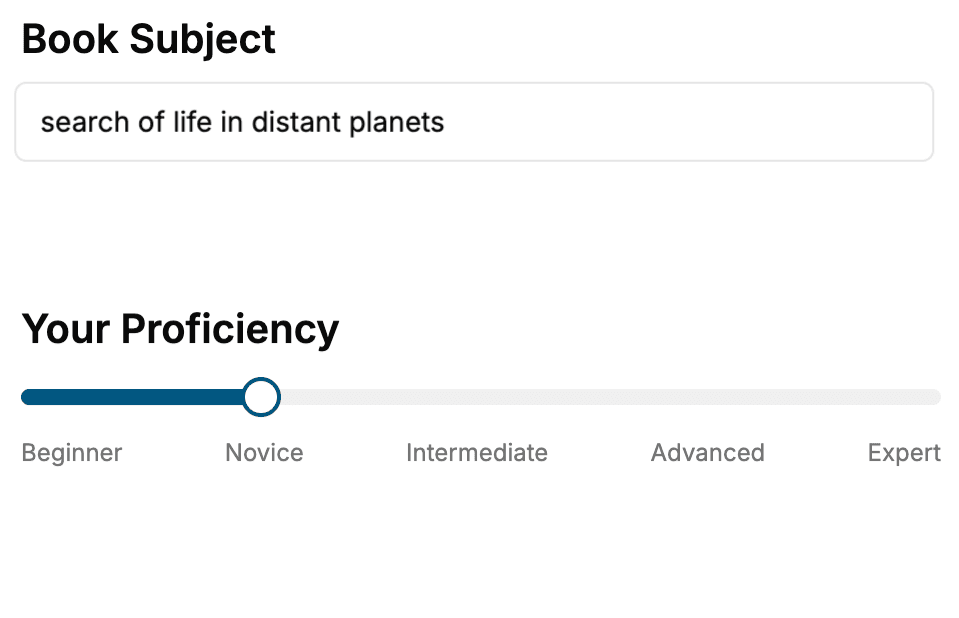
Select the focus of your Time series book and share your background
- 2. Personalize your book
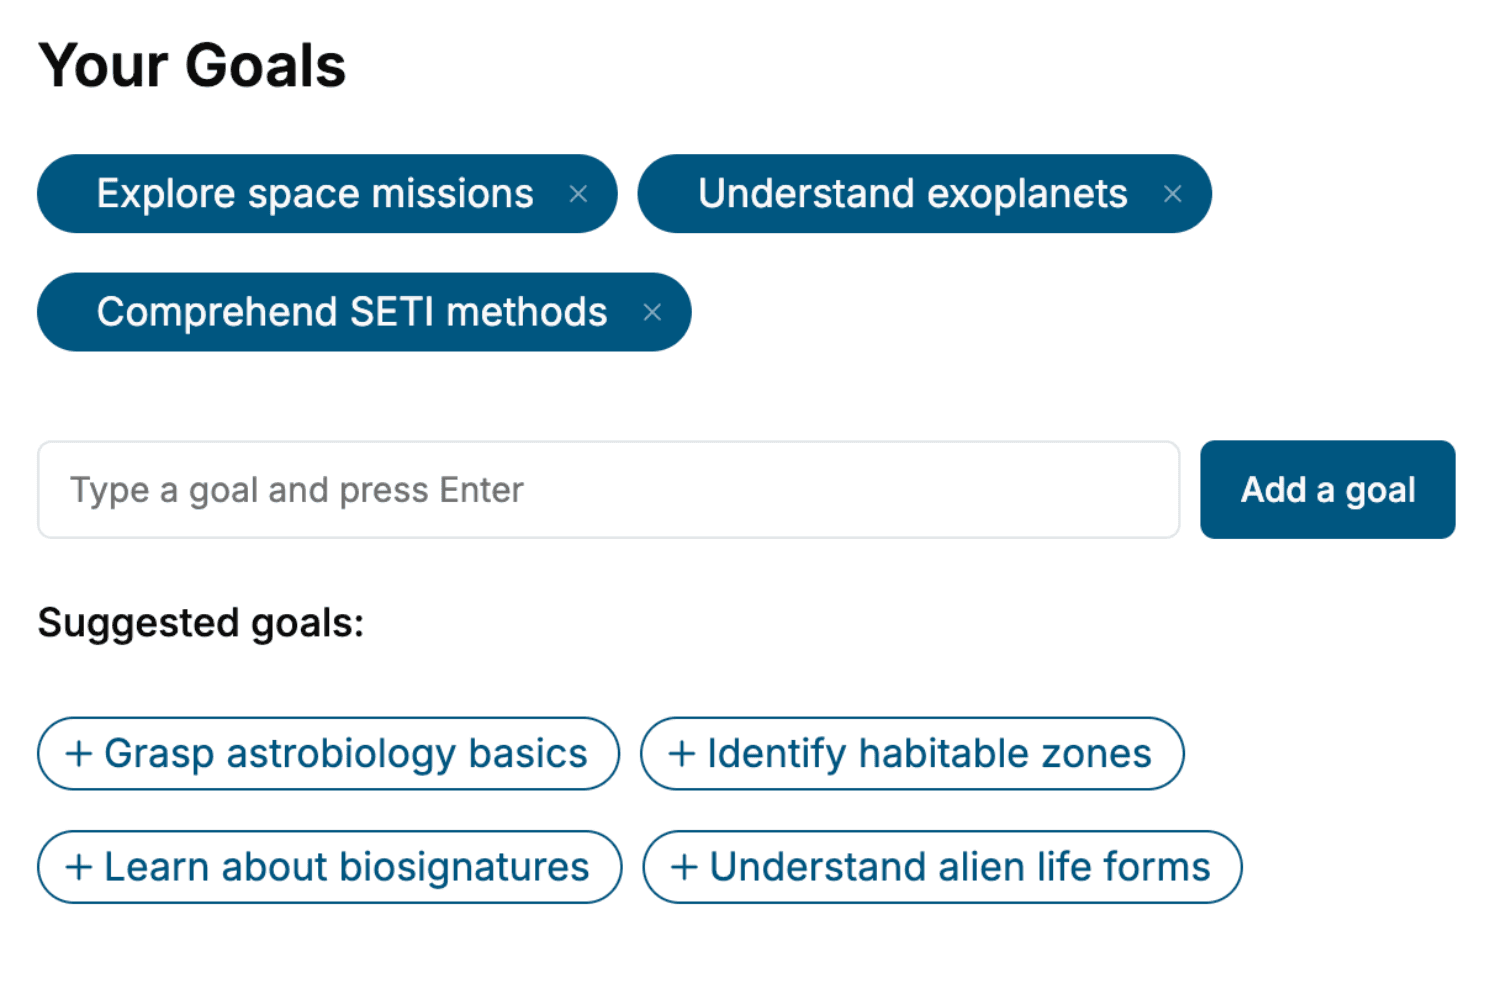
Specify your goals and choose sub-topics to include
- 3. Get your tailored book
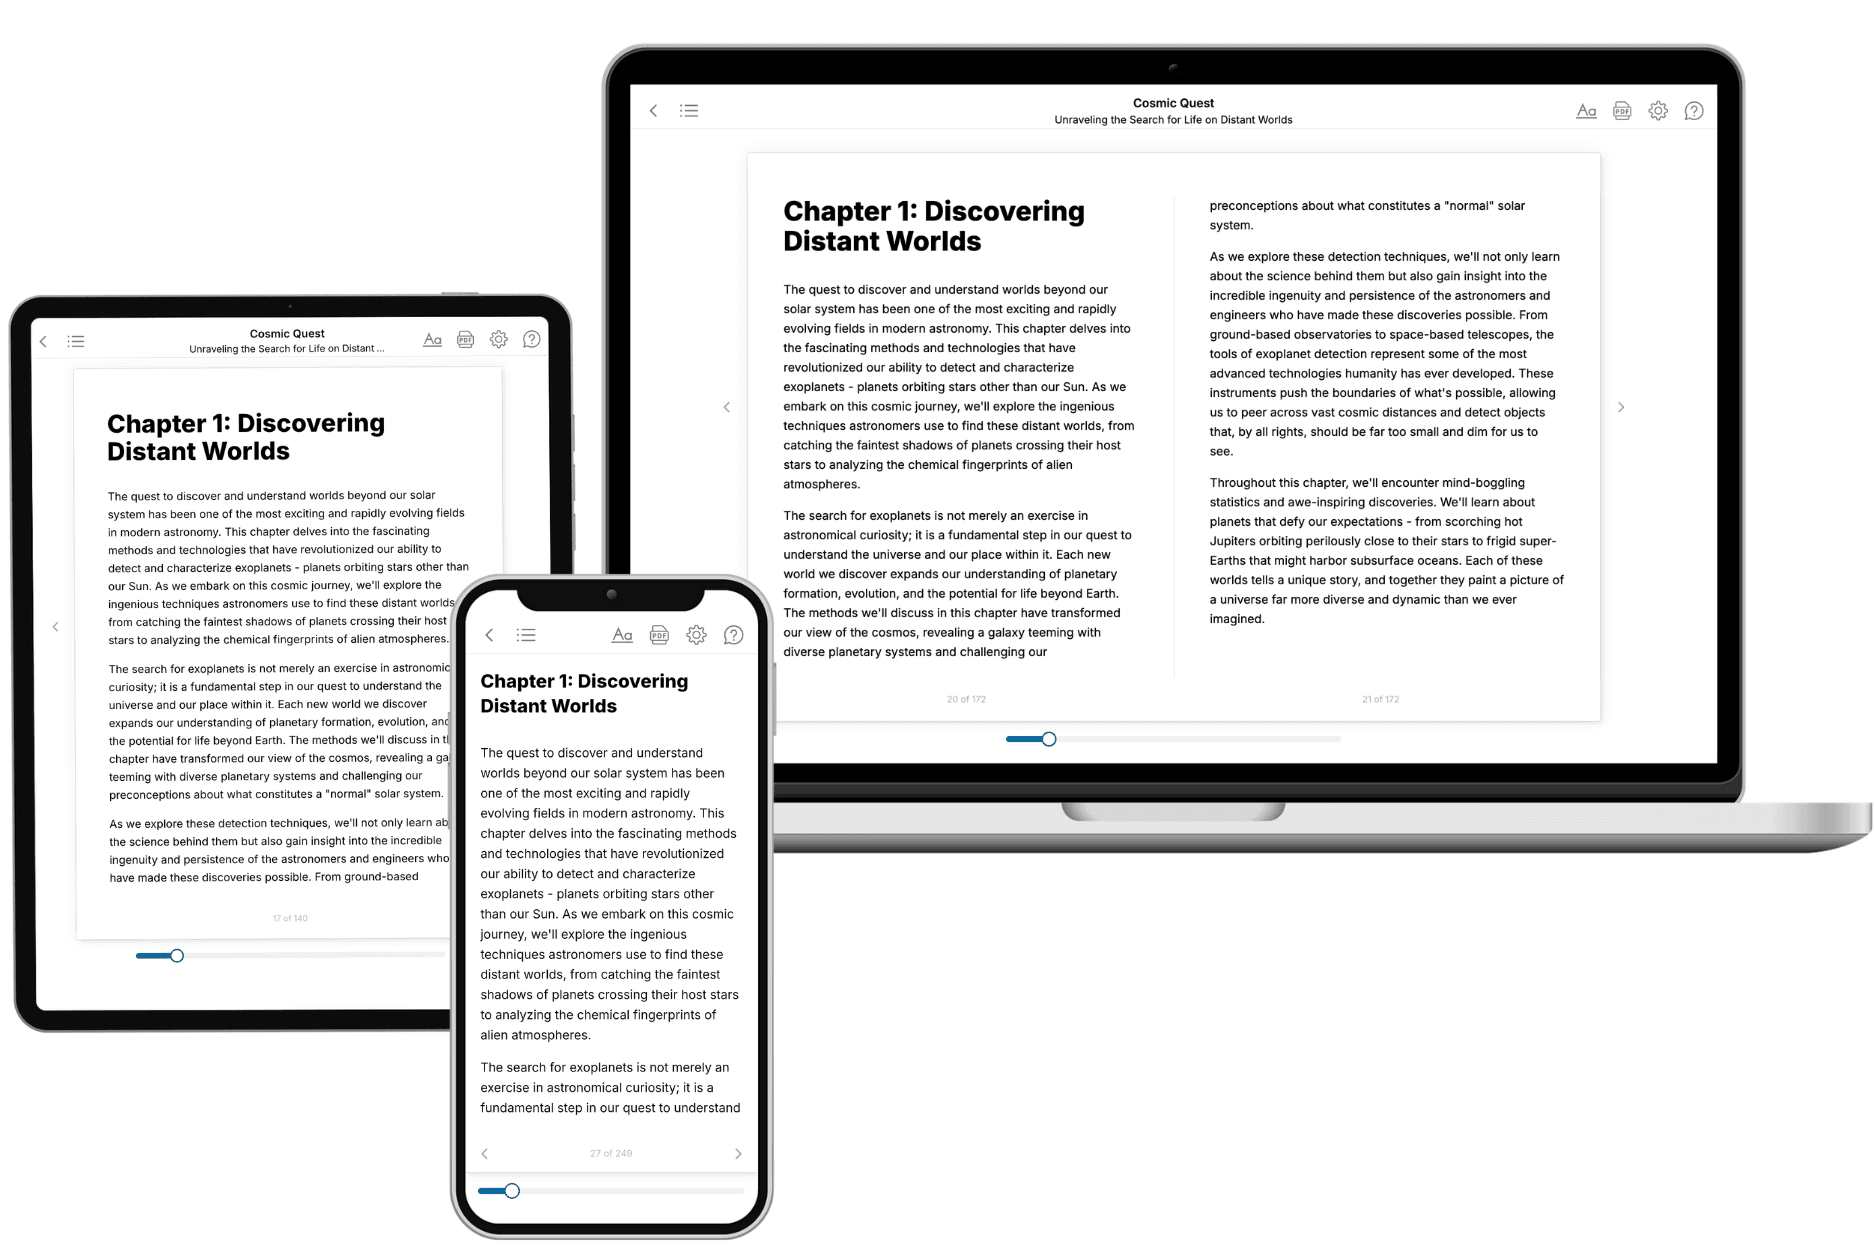
Your book is ready in 10 minutes. Read it online, download as EPUB or PDF, or send to Kindle.
Frequently asked questions
- What is TailoredRead?
TailoredRead creates complete, full-length nonfiction ebooks, written specifically for you. Tell us what you want to learn and why, and TailoredRead writes you a complete ebook on it, with charts, tables, and diagrams throughout. Read it online, on Kindle, or on any e-reader, or download it as a PDF or EPUB. Every book is written fresh the day you order it.
- How is the book tailored to me?
Before anything is written, you answer a few short questions about your goals, your background, and the topics you care about. Your book is then planned around your answers: written at your level, focused on your goals, and covering the topics you chose, instead of the one-size-fits-all book a store sells everyone.
- Will it read like generic AI content?
No. Your book isn't a chat transcript: it's planned chapter by chapter before a single word is written, told in a clear book voice, and explains ideas visually with charts, tables, and diagrams. After writing, every book goes through an editorial pass that polishes chapters so the book reads consistent from start to finish. Judge for yourself: browse thousands of sample books on our Explore Books page.
- How accurate is the content?
Our AI first checks whether your subject needs live research. Niche and fast-moving subjects are researched before writing, and the book plan and chapters are grounded in what it finds. After writing, every book goes through a quality pass that checks its facts and consistency, and researched books list their sources in a Notes section at the back.
- How long is the book?
You choose the length: Comprehensive (250-300 pages), Detailed (150-200 pages), Essential (70-100 pages), or Short (30-50 pages).
- Does the book include visuals?
Yes. Every book includes charts, tables, and diagrams: timelines, checklists, step-by-step guides, decision trees, comparison tables, matrices, and bar charts. A typical book includes dozens of these visual elements.
- Can I read it on Kindle? What formats can I download?
Yes. Every book can be read in our online reader or downloaded as a PDF or EPUB. The EPUB can be opened with Kindle, Apple Books, Kobo, and any e-reader. The Commercial and Author licenses also include an editable Word (DOCX) and Markdown download.
- How much does it cost?
About the price of a regular ebook. The exact price depends on your book's length and complexity, from $2 for the shortest books to $35 for the most comprehensive, and it's shown when you review your book, before you commit to anything. Each book is a one-time purchase, yours to keep, no subscription. Licenses that let you share, teach, or publish your book range from $35.99 to $49.99.
- Can I preview the book before purchasing?
Before you pay, you'll see what your book will cover: the title, a detailed description, the estimated length, and the complete chapter-by-chapter table of contents, so you know what you're getting before you decide. The full text itself is written after you purchase.
- How long does it take to create a book?
About 10 minutes. You can start reading the opening chapters while the rest is still being written.