Trigonometric Graphs Mastery
From Sine Waves to Real-World Applications—A Complete Visual Guide
What if the patterns you see in ocean waves, sound frequencies, and electrical currents all follow the same mathematical rules?
238 pages11 chaptersNov 19, 2025Trigonometry
About this book
Trigonometric graphs are far more than abstract equations on a page—they're the visual language of periodic phenomena that shape our world. This book bridges the gap between memorizing formulas and truly understanding how trigonometric functions behave. You'll discover why sine and cosine waves look the way they do, how small changes in equations create dramatic visual transformations, and how these graphs solve real problems in physics, engineering, and technology. Through clear explanations, intuitive diagrams, and practical examples, you'll develop the visual intuition needed to sketch, analyze, and apply trigonometric graphs with confidence. Whether you're preparing for advanced mathematics, pursuing a STEM career, or simply curious about the mathematics underlying natural phenomena, this guide transforms trigonometric graphs from intimidating abstractions into powerful tools you can actually use.
Table of contents
- IntroductionWhy Trigonometric Graphs Matter, What You'll Learn in This Book, How to Use This Guide, What You Need to Know Before StartingRead below
- Chapter 1: The Foundation: Understanding Trigonometric FunctionsBeyond Right Triangles: The Unit Circle, Sine, Cosine, and Tangent Defined, The Periodic Nature of Trigonometric Functions, Radians vs. Degrees: Choosing Your Measurement
- Chapter 2: The Sine Graph: Your First Trigonometric WaveAnatomy of the Sine Graph, Amplitude and Period: The Basic Properties, Sketching Sine Graphs by Hand, Sine Graphs in Sound and Light Waves
- Chapter 3: The Cosine Graph: A Shifted PerspectiveHow Cosine Differs from Sine, Understanding Phase Shift, Cosine in Circular Motion and Oscillations, Comparing Sine and Cosine Side by Side
- Chapter 4: The Tangent Graph: Discontinuities and AsymptotesWhy Tangent Looks Different, Understanding Vertical Asymptotes, The Period of Tangent and Its Implications, Tangent in Angles of Elevation and Slopes
- Chapter 5: Transformations: Stretching, Shifting, and ReflectingVertical Stretches and Compressions, Horizontal Stretches and Compressions, Vertical Shifts and Midlines, Reflections Across Axes
- Chapter 6: Reciprocal Trigonometric Functions: Cosecant, Secant, and CotangentUnderstanding Reciprocal Relationships, The Cosecant Graph and Its Asymptotes, Secant and Cotangent Graphs, When and Why to Use Reciprocal Functions
- Chapter 7: Inverse Trigonometric Functions: Finding Angles from RatiosThe Concept of Inverse Functions, Arcsine and Arccosine Graphs, Arctangent and Other Inverse Functions, Solving Problems with Inverse Trigonometric Functions
- Chapter 8: Combining Functions: Addition, Multiplication, and CompositionAdding Trigonometric Functions, Multiplying Trigonometric Functions and Damping, Composing Trigonometric Functions, Analyzing Complex Trigonometric Graphs
- Chapter 9: Real-World Applications: From Physics to EngineeringAlternating Current and Electrical Circuits, Mechanical Vibrations and Harmonic Motion, Waves, Sound, and Acoustics, Navigation, Surveying, and Positioning
- Chapter 10: Technology Tools: Graphing Calculators and SoftwareUsing Graphing Calculators Effectively, Graphing Software and Online Tools, Interpreting Technology Results Critically, Common Mistakes and How to Catch Them
- Chapter 11: Problem-Solving Strategies and PracticeA Systematic Approach to Graph Analysis, Worked Examples Across Different Contexts, Common Pitfalls and How to Avoid Them
- ConclusionYou've Achieved Mastery, Next Steps in Your Mathematical Journey
- Glossary of Key Terms
- Further Reading and Resources
Introduction
Have you ever watched ocean waves roll toward the shore, listened to a musical note resonate through the air, or noticed the rhythmic swing of a pendulum? These seemingly different phenomena share a common mathematical foundation: they all follow patterns described by trigonometric graphs. While trigonometry often begins with right triangles and angle measurements, its true power emerges when you visualize these relationships as continuous, flowing curves that repeat in predictable cycles. These graphs aren't just abstract mathematical constructs—they're the visual language that scientists, engineers, and technologists use to understand and manipulate the periodic behaviors that shape our world.
The journey from memorizing sine and cosine values to truly understanding trigonometric graphs represents a significant leap in mathematical thinking. Many learners can calculate trigonometric ratios or solve triangle problems but struggle when asked to sketch a graph or interpret a wave pattern. This gap exists because trigonometric graphs require you to think dynamically rather than statically, to see functions as continuous processes rather than isolated calculations. When you develop this visual intuition, trigonometry transforms from a collection of formulas into a coherent system that makes sense. Suddenly, you can predict how changing one parameter will affect an entire graph, recognize patterns in complex data, and apply these insights to solve real problems.
This book bridges that gap by building your understanding systematically, connecting each concept to both its mathematical foundation and its practical applications. You'll discover why trigonometric graphs look the way they do, how transformations affect their shape and position, and how these visual patterns appear in everything from alternating electrical current to the motion of planets. Whether you're a student preparing for advanced mathematics courses, a professional seeking to strengthen your technical foundation, or simply someone curious about the mathematics underlying natural phenomena, this guide will equip you with the knowledge and confidence to master trigonometric graphs. The goal isn't just to help you pass an exam—it's to give you a lasting understanding that you can apply throughout your academic and professional life.
Why Trigonometric Graphs Matter
Trigonometric graphs serve as the universal language for describing periodic phenomena—events that repeat in regular cycles. When an engineer designs a suspension bridge, they must account for oscillations caused by wind and traffic. When a sound engineer adjusts audio frequencies, they're manipulating sine waves with different amplitudes and periods. When a physicist models electromagnetic radiation, they're working with trigonometric functions that describe how electric and magnetic fields oscillate through space. In each case, the ability to visualize and interpret trigonometric graphs is essential. These graphs provide immediate insight that equations alone cannot offer, allowing professionals to spot patterns, identify problems, and optimize solutions at a glance.
The visual nature of trigonometric graphs makes complex relationships comprehensible. Consider the equation y = 3sin(2x - π/4) + 1. Without graphing it, you might struggle to understand what this function actually does. But when you visualize it as a wave, you immediately see that it oscillates between -2 and 4, completes a full cycle every π units, and starts slightly to the right of the origin. This visual understanding allows you to make predictions, compare different functions, and communicate mathematical ideas effectively. In professional settings, being able to sketch a quick graph during a meeting or recognize a pattern in oscilloscope data can be the difference between solving a problem efficiently and spending hours on unnecessary calculations.
Beyond their practical applications, trigonometric graphs reveal deep connections between geometry, algebra, and calculus. The unit circle provides the geometric foundation, showing how circular motion generates the sine and cosine waves. Algebraic transformations—stretching, shifting, reflecting—follow predictable rules that apply across all functions, not just trigonometric ones. When you later study calculus, you'll discover that the derivatives and integrals of trigonometric functions have elegant geometric interpretations visible in their graphs. Understanding these connections doesn't just help you master trigonometry; it strengthens your overall mathematical thinking and prepares you for more advanced topics. The patterns you learn to recognize in trigonometric graphs will serve you throughout your mathematical education.
In the modern world, trigonometric graphs appear in technologies you use every day, even if you don't realize it. Your smartphone's touchscreen uses signal processing based on trigonometric functions to distinguish intentional touches from accidental ones. Digital music files compress audio data by analyzing the sine wave components of sound. GPS systems calculate your position using trigonometric relationships between satellites and your receiver. Medical imaging technologies like MRI and CT scans reconstruct images from trigonometric transformations of signal data. Climate scientists use trigonometric functions to model seasonal temperature variations and predict long-term trends. By understanding trigonometric graphs, you gain insight into the mathematical principles underlying these technologies, making you a more informed user and potentially opening career paths in fields that rely on this knowledge.
The ability to work with trigonometric graphs also develops broader analytical skills that transfer to other domains. When you learn to identify amplitude, period, phase shift, and vertical shift from a graph, you're practicing pattern recognition and systematic analysis. When you predict how a transformation will affect a graph before plotting it, you're developing spatial reasoning and logical thinking. When you connect a mathematical model to a physical phenomenon, you're building the interdisciplinary thinking that characterizes successful scientists and engineers. These metacognitive skills—knowing how to approach unfamiliar problems, checking your work for consistency, and building intuition through practice—are valuable far beyond mathematics. Mastering trigonometric graphs thus serves as training for the kind of analytical thinking that employers value across industries.
Perhaps most importantly, understanding trigonometric graphs empowers you to move from passive consumption of mathematical knowledge to active creation and problem-solving. Instead of relying on a calculator or software to generate graphs without understanding them, you'll be able to sketch functions by hand, verify that technology outputs make sense, and catch errors that might otherwise go unnoticed. This independence is crucial in academic settings, where you need to demonstrate understanding on exams, and in professional contexts, where you must make decisions based on mathematical models. When you truly understand trigonometric graphs, you become a creator of mathematical knowledge rather than just a consumer, capable of adapting your skills to new situations and learning advanced topics more easily.
The journey to mastering trigonometric graphs requires patience and practice, but the rewards are substantial. You'll gain a powerful tool for understanding the natural world, a foundation for advanced mathematics and science courses, and practical skills applicable to numerous careers. More than that, you'll experience the satisfaction of seeing abstract mathematical concepts come to life as visual patterns that make intuitive sense. This book is designed to guide you through that journey systematically, building your understanding step by step until trigonometric graphs become second nature. The investment you make in learning this material will pay dividends throughout your academic and professional life, opening doors to opportunities that require strong quantitative skills and analytical thinking.
What You'll Learn in This Book
This book takes you on a carefully structured journey from foundational concepts to advanced applications, ensuring that each new idea builds logically on what you've already learned. You'll begin by establishing a solid understanding of trigonometric functions themselves, moving beyond the right-triangle definitions you may have encountered previously to embrace the unit circle perspective. This geometric foundation is crucial because it explains why trigonometric functions are periodic, why they have the specific shapes they do, and how they relate to circular motion. You'll learn to think of sine, cosine, and tangent not as isolated ratios but as continuous functions that trace out predictable patterns as angles increase without bound.
The core chapters of the book focus on the three primary trigonometric graphs: sine, cosine, and tangent. For each function, you'll learn to identify its key characteristics and understand what makes it unique:
- Sine graphs: You'll master amplitude, period, and the smooth wave pattern that models everything from sound waves to tidal patterns
- Cosine graphs: You'll understand how cosine relates to sine through phase shifts and why it's preferred for modeling certain types of oscillations
- Tangent graphs: You'll learn to work with discontinuities and vertical asymptotes, understanding why tangent behaves so differently from sine and cosine
Transformations form a critical component of your learning, as they allow you to understand how modifications to equations affect graph appearance. You'll develop a systematic approach to analyzing transformed trigonometric functions, learning to identify four key transformations and their effects:
- Vertical stretches and compressions that change amplitude
- Horizontal stretches and compressions that alter period
- Horizontal shifts that create phase shifts
- Vertical shifts that move the midline
y = -2cos(3x + π) - 1 and predict exactly what the graph will look like before plotting a single point.
The book extends beyond the basic three functions to cover reciprocal trigonometric functions (cosecant, secant, and cotangent) and inverse trigonometric functions (arcsine, arccosine, and arctangent). These functions appear less frequently in introductory courses but are essential for advanced applications. You'll learn why reciprocal functions have the asymptotes they do, how their graphs relate to the original functions, and when they're useful in problem-solving. For inverse functions, you'll understand the concept of restricting domains to create true inverses, interpret their graphs as reflections across the line y = x, and apply them to find angles when you know trigonometric ratios—a crucial skill in navigation, surveying, and engineering calculations.
Advanced chapters explore how trigonometric functions combine through addition, multiplication, and composition to create complex behaviors. When you add two sine waves with different frequencies, you create beat patterns that musicians and acoustical engineers must understand. When you multiply a trigonometric function by an exponential decay function, you model damped oscillations like a swinging pendulum gradually coming to rest. When you compose functions, creating expressions like sin(cos(x)), you generate intricate patterns that appear in signal processing and chaos theory. These combinations demonstrate how simple trigonometric building blocks can model sophisticated real-world systems, and you'll learn systematic approaches to analyzing and graphing these complex functions.
Real-world applications receive substantial attention throughout the book, with an entire chapter dedicated to showing how trigonometric graphs appear in various fields:
- Electrical engineering: Alternating current, voltage waves, and circuit analysis
- Mechanical engineering: Harmonic motion, vibration analysis, and resonance
- Physics: Wave mechanics, light propagation, and quantum mechanics
- Surveying and navigation: Position calculation, angle measurement, and GPS technology
- Acoustics: Sound waves, frequency analysis, and audio engineering
Technology tools receive thoughtful coverage that balances their utility with the importance of conceptual understanding. You'll learn to use graphing calculators and software like Desmos, GeoGebra, and graphing calculator apps effectively, understanding their capabilities and limitations. More importantly, you'll develop the critical thinking skills needed to interpret technology-generated graphs, verify that results make sense, and catch common errors. The book emphasizes that technology should enhance your understanding, not replace it—you should be able to predict what a graph will look like before using technology to verify your prediction. This approach ensures that you remain in control of the mathematics rather than becoming dependent on tools you don't fully understand.
Throughout the book, problem-solving strategies and worked examples demonstrate how to approach unfamiliar problems systematically. You'll learn to break complex problems into manageable steps, identify what information you need, choose appropriate methods, and verify your solutions. Common pitfalls receive explicit attention, with explanations of why certain mistakes happen and how to avoid them. By the time you finish this book, you'll have not just knowledge of trigonometric graphs but also the problem-solving skills and confidence to tackle new situations independently. This combination of conceptual understanding, practical skills, and strategic thinking represents true mastery of the subject.
How to Use This Guide
This book is designed to be read sequentially, with each chapter building on concepts introduced in previous ones. While you might be tempted to skip ahead to topics that seem immediately relevant, resist that urge initially. The early chapters establish foundational concepts—particularly the unit circle and basic function properties—that are essential for understanding everything that follows. Even if you think you already know this material, reviewing it in the context of graphing will likely reveal new insights and connections. Once you've worked through the book once, you can certainly return to specific chapters as reference material when you need to refresh your understanding of particular topics or solve specific types of problems.
Active engagement with the material is crucial for developing true understanding. Reading passively won't build the visual intuition and problem-solving skills you need. Instead, approach each chapter with paper, pencil, and possibly a graphing calculator nearby. When the text describes how to sketch a graph, actually sketch it yourself rather than just reading the description. When an example problem is presented, try solving it yourself before reading the solution. When transformations are discussed, experiment with different parameter values to see how they affect graphs. This hands-on practice is where real learning happens—your brain needs to actively process and apply information, not just passively receive it.
The book includes various elements designed to enhance your learning, and you should engage with each type deliberately:
- Worked examples: Study these carefully, paying attention to the reasoning process, not just the final answer. Try to understand why each step is necessary and how you might recognize similar situations in the future.
- Blockquotes: These highlight important principles, real-world examples, or key insights. Pause to reflect on these rather than skimming past them.
- Lists and structured information: These break down complex processes into manageable steps. Use them as checklists when solving problems on your own.
- Technical terms: When new vocabulary appears in emphasis or code formatting, make sure you understand it before continuing. The glossary at the end provides quick reference for definitions.
Practice is essential for mastering trigonometric graphs, and you should supplement this book with additional problems from textbooks, online resources, or practice problem sets. The book provides worked examples and explanations, but you need to solve many problems independently to develop fluency. Start with straightforward problems that closely match the examples in each chapter, then gradually tackle more challenging variations. When you make mistakes—and you will—treat them as learning opportunities. Analyze what went wrong, understand why your approach didn't work, and figure out what you should have done differently. This reflective practice builds the problem-solving skills that distinguish true mastery from superficial understanding.
Technology should complement your learning, not replace manual practice. Use graphing calculators or software to verify your hand-drawn sketches, explore how different parameters affect graphs, and visualize complex functions that would be tedious to plot by hand. However, don't become dependent on technology for basic tasks. You should be able to sketch simple trigonometric graphs without a calculator, identify key features from equations, and predict transformations mentally. Technology is most valuable when you already understand the concepts and use it to extend your capabilities, not when you rely on it to compensate for gaps in understanding. The chapter on technology tools provides specific guidance on striking this balance effectively.
Different learners have different strengths, and you should adapt your approach based on what works best for you. If you're a visual learner, spend extra time studying the graphs themselves, perhaps creating color-coded sketches that highlight different features. If you're more algebraically inclined, focus on understanding how equation parameters map to graph characteristics, perhaps creating tables that systematize these relationships. If you learn best through applications, pay special attention to the real-world examples and try to find additional applications in fields that interest you. The book provides multiple entry points to each concept—geometric, algebraic, and applied—so you can emphasize the approaches that resonate most strongly with your learning style while still developing well-rounded understanding.
Pacing yourself appropriately is important for retention and avoiding frustration. Trigonometric graphs involve many interconnected concepts, and trying to absorb everything too quickly leads to confusion. Plan to spend adequate time with each chapter, perhaps working through one chapter per week if you're studying independently, or following your course schedule if you're using this book as a supplement. Take breaks when you feel overwhelmed, and return to difficult concepts after giving your brain time to process them unconsciously. Learning mathematics is not a linear process—sometimes understanding clicks suddenly after a period of struggle. Trust the process, maintain consistent effort, and be patient with yourself as you develop new ways of thinking about functions and their graphs.
Finally, consider forming a study group or finding a study partner if possible. Explaining concepts to others is one of the most effective ways to deepen your own understanding, and hearing how others think about problems can reveal approaches you hadn't considered. When you work through examples together, you can catch each other's mistakes, share insights, and maintain motivation through challenging material. If in-person collaboration isn't possible, online forums and communities dedicated to mathematics learning can provide similar benefits. Teaching and learning are deeply interconnected—by helping others understand trigonometric graphs, you'll strengthen your own mastery and discover aspects of the subject you hadn't fully appreciated before.
What You Need to Know Before Starting
This book assumes you have foundational knowledge of basic trigonometry, particularly the definitions of sine, cosine, and tangent in right triangles. You should be comfortable with the idea that in a right triangle, sine equals opposite over hypotenuse, cosine equals adjacent over hypotenuse, and tangent equals opposite over adjacent. You don't need to have these ratios memorized for every special angle, but you should understand the concept and be able to calculate these ratios given a triangle with known side lengths. If you've never encountered trigonometry before, you should work through an introductory trigonometry resource before tackling this book, as it focuses specifically on graphs rather than introducing trigonometric concepts from scratch.
Familiarity with the coordinate plane and basic graphing is essential. You should understand how to plot points using x and y coordinates, recognize the four quadrants, and sketch simple functions like linear and quadratic equations. The concept of a function—a relationship where each input produces exactly one output—should be clear to you, along with function notation like f(x). You'll need to understand domain (the set of possible input values) and range (the set of possible output values), as these concepts are crucial for understanding trigonometric functions. If you're rusty on these topics, reviewing basic algebra and function concepts before starting this book will make your learning much smoother.
Understanding of angle measurement in both degrees and radians is important, though the book will review this relationship. You should know that a full circle contains 360 degrees or 2π radians, and ideally you should be comfortable converting between these units. Radians are the preferred unit in advanced mathematics because they simplify many formulas and reveal deeper mathematical relationships, so you'll need to become comfortable thinking in radians even if degrees feel more intuitive initially. The book will help you develop this comfort, but having some prior exposure to radians will make the transition easier. At minimum, you should understand that radians measure angles based on arc length rather than arbitrary divisions of a circle.
Basic algebraic manipulation skills are necessary for working with trigonometric equations and transformations. You should be able to:
- Solve simple equations for a variable
- Understand how operations affect equations (adding constants, multiplying by coefficients)
- Work with negative numbers and fractions confidently
- Recognize and factor common algebraic expressions
- Understand function composition and inverse operations at a basic level
Some exposure to the unit circle is helpful but not strictly required, as the book covers this concept thoroughly in the first chapter. The unit circle—a circle with radius 1 centered at the origin—provides the geometric foundation for understanding trigonometric functions beyond right triangles. If you've seen the unit circle before, even if you didn't fully understand it, you'll find the treatment in this book clarifies and extends that knowledge. If the unit circle is completely new to you, don't worry—the book introduces it carefully and shows why it's so important for understanding trigonometric graphs. This concept is central enough that the book doesn't assume prior mastery, but any familiarity you have will give you a head start.
You don't need advanced mathematical knowledge to benefit from this book. Calculus is not required, though if you've studied derivatives and integrals, you'll find interesting connections to those concepts mentioned occasionally. Complex numbers are not necessary, though they provide elegant explanations for some trigonometric identities that the book mentions briefly. Linear algebra and differential equations are not prerequisites, though students studying those subjects will find that understanding trigonometric graphs enhances their work in those areas. The book is designed for learners at the intermediate level—beyond basic trigonometry but before advanced calculus—and it provides all the mathematical tools you need within that scope.
Perhaps most importantly, you need curiosity and persistence. Trigonometric graphs can seem abstract and confusing at first, especially if you're accustomed to thinking of trigonometry only in terms of triangles. You'll need patience as you develop new ways of visualizing mathematical relationships and build intuition about how functions behave. Some concepts will click immediately, while others may require multiple exposures and considerable practice before they make sense. This is normal and expected—mathematics learning is rarely linear. What matters is maintaining consistent effort, asking questions when you're confused, and trusting that understanding will develop with time and practice. If you bring intellectual curiosity and willingness to work through challenges, you have everything you need to master trigonometric graphs.
In terms of materials, you'll benefit from having graph paper for sketching functions, a scientific calculator (or graphing calculator if available), and possibly access to graphing software like Desmos or GeoGebra. These tools aren't absolutely necessary—you can learn the concepts with just paper and pencil—but they make practice more efficient and allow you to verify your work. A notebook dedicated to working through examples and practice problems will help you track your progress and create a reference you can return to later. Some learners also find it helpful to create summary sheets or flashcards for key concepts, formulas, and graph characteristics. Choose whatever tools and organizational systems work best for your learning style, but make sure you have the basic materials needed to actively engage with the content rather than just reading passively.
This is the end of the free sample. The full book has 11 chapters.
Want this book written for you?
Tell us your goals and background, and get your own version of this book, tailored by AI to you.


Benefits of AI-tailored books
- Read one book, not ten:
- all the Trigonometry knowledge you need, gathered into a single book.
- Save days of learning:
- tell us your goals, choose your topics, and the whole book is built around them.
- Learn effortlessly:
- Trigonometry book written for your specific background and expertise.
- Understand at a glance:
- includes charts, tables, timelines, checklists, decision trees, and more.
- Stay current:
- written the day you order it, not years ago.
- Trust what you read:
- every book is checked for accuracy, with real research when your subject needs it.
Create your unique book in 3 steps
- 1. Select your focus
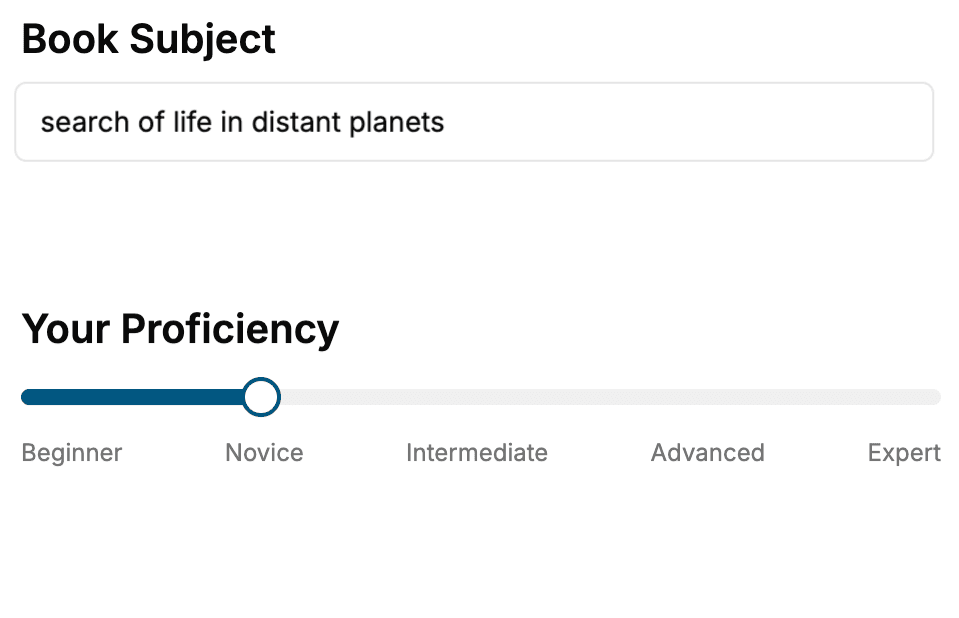
Select the focus of your Trigonometry book and share your background
- 2. Personalize your book
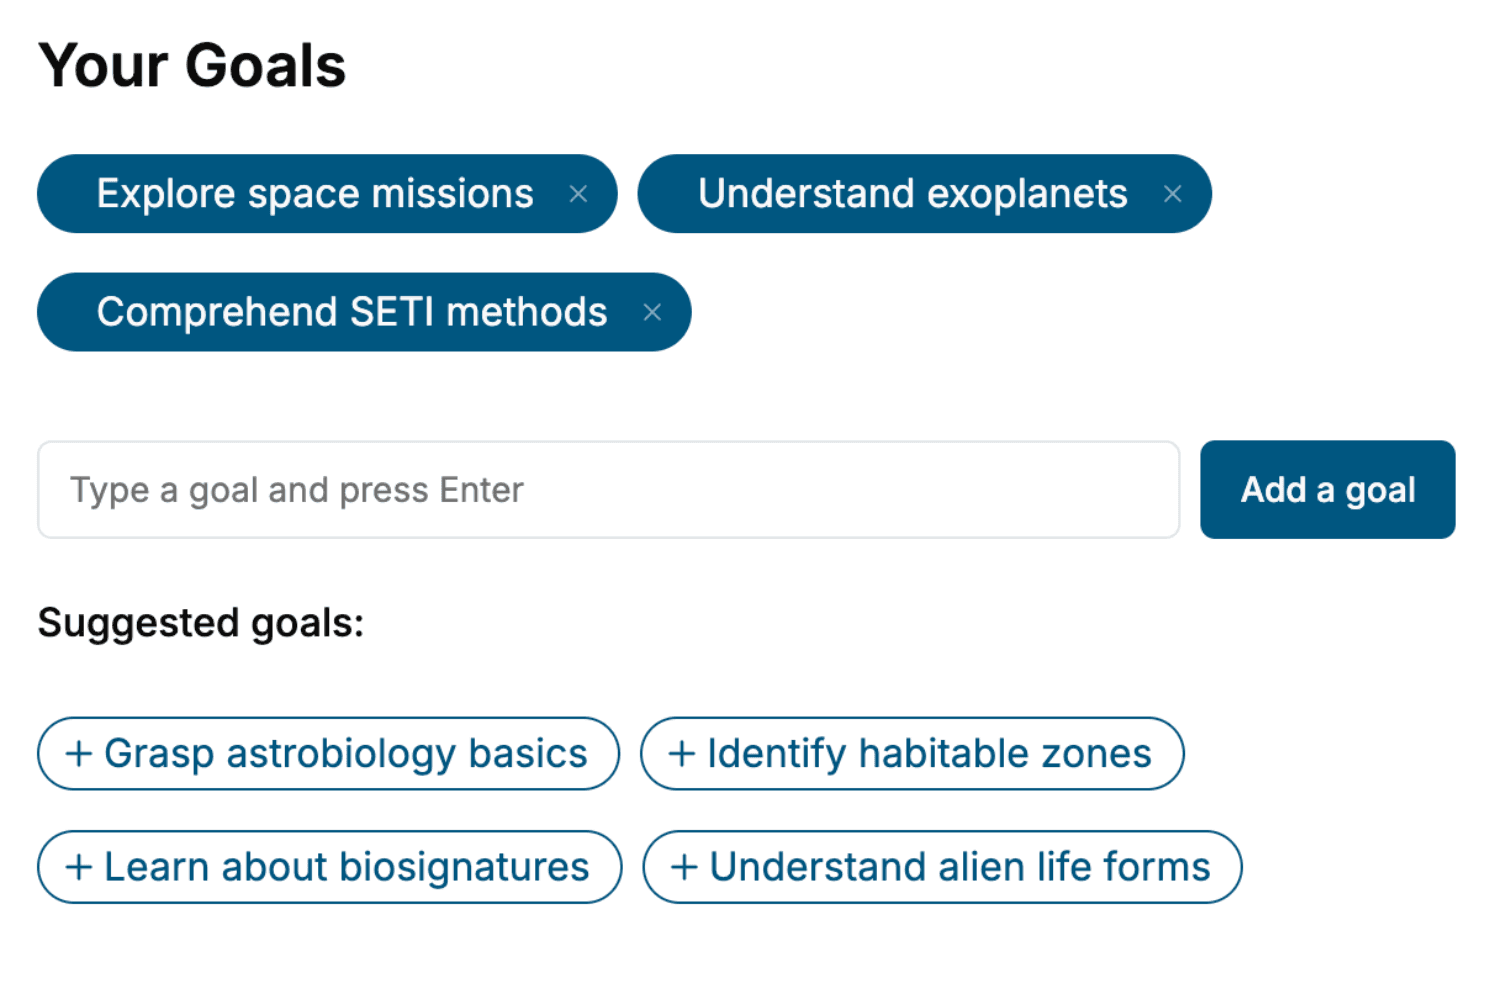
Specify your goals and choose sub-topics to include
- 3. Get your tailored book
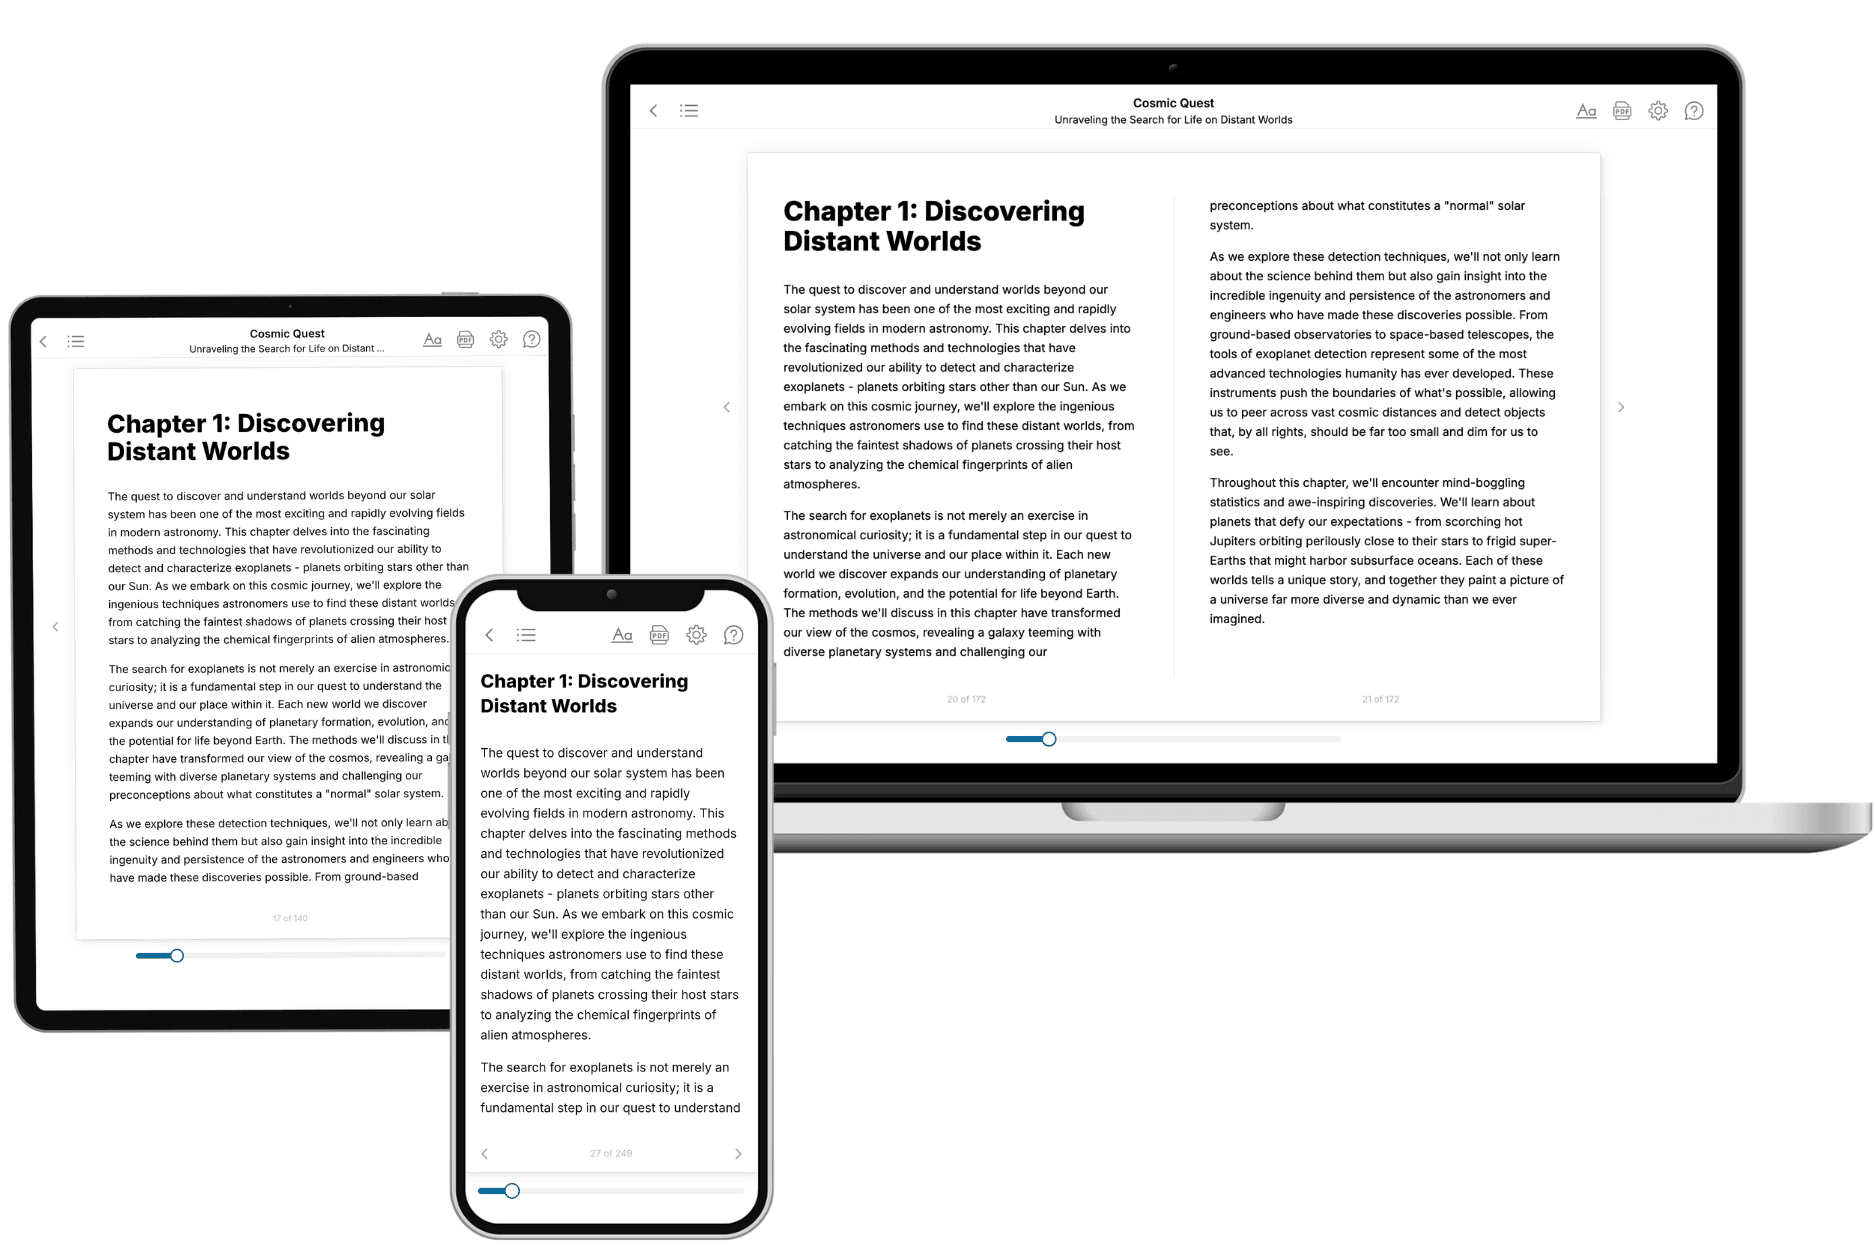
Your book is ready in 10 minutes. Read it online, download as EPUB or PDF, or send to Kindle.
Frequently asked questions
- What is TailoredRead?
TailoredRead creates complete, full-length nonfiction ebooks, written specifically for you. Tell us what you want to learn and why, and TailoredRead writes you a complete ebook on it, with charts, tables, and diagrams throughout. Read it online, on Kindle, or on any e-reader, or download it as a PDF or EPUB. Every book is written fresh the day you order it.
- How is the book tailored to me?
Before anything is written, you answer a few short questions about your goals, your background, and the topics you care about. Your book is then planned around your answers: written at your level, focused on your goals, and covering the topics you chose, instead of the one-size-fits-all book a store sells everyone.
- Will it read like generic AI content?
No. Your book isn't a chat transcript: it's planned chapter by chapter before a single word is written, told in a clear book voice, and explains ideas visually with charts, tables, and diagrams. After writing, every book goes through an editorial pass that polishes chapters so the book reads consistent from start to finish. Judge for yourself: browse thousands of sample books on our Explore Books page.
- How accurate is the content?
Our AI first checks whether your subject needs live research. Niche and fast-moving subjects are researched before writing, and the book plan and chapters are grounded in what it finds. After writing, every book goes through a quality pass that checks its facts and consistency, and researched books list their sources in a Notes section at the back.
- How long is the book?
You choose the length: Comprehensive (250-300 pages), Detailed (150-200 pages), Essential (70-100 pages), or Short (30-50 pages).
- Does the book include visuals?
Yes. Every book includes charts, tables, and diagrams: timelines, checklists, step-by-step guides, decision trees, comparison tables, matrices, and bar charts. A typical book includes dozens of these visual elements.
- Can I read it on Kindle? What formats can I download?
Yes. Every book can be read in our online reader or downloaded as a PDF or EPUB. The EPUB can be opened with Kindle, Apple Books, Kobo, and any e-reader. The Commercial and Author licenses also include an editable Word (DOCX) and Markdown download.
- How much does it cost?
About the price of a regular ebook. The exact price depends on your book's length and complexity, from $2 for the shortest books to $35 for the most comprehensive, and it's shown when you review your book, before you commit to anything. Each book is a one-time purchase, yours to keep, no subscription. Licenses that let you share, teach, or publish your book range from $35.99 to $49.99.
- Can I preview the book before purchasing?
Before you pay, you'll see what your book will cover: the title, a detailed description, the estimated length, and the complete chapter-by-chapter table of contents, so you know what you're getting before you decide. The full text itself is written after you purchase.
- How long does it take to create a book?
About 10 minutes. You can start reading the opening chapters while the rest is still being written.