Ultraviolet-Visible Spectroscopy Essentials
Master the Science and Practice of UV-Vis Analysis for Research and Industry
Many scientists and technicians struggle with UV-Vis spectroscopy because they treat it as a simple "point and measure" technique, missing the nuances that separate reliable data from misleading results.
222 pages10 chaptersMay 9, 2026Spectroscopy
About this book
This book cuts through that misconception by providing a clear, practical foundation in ultraviolet-visible spectroscopy—from the physics of light absorption to real-world troubleshooting. You'll learn how to select appropriate wavelengths, prepare samples correctly, calibrate instruments accurately, and interpret spectra with confidence. Whether you're working in pharmaceutical analysis, environmental testing, materials characterization, or academic research, this guide equips you with the knowledge to design better experiments, avoid common pitfalls, and extract meaningful insights from your data. Packed with practical examples, troubleshooting tips, and decision-making frameworks, this book transforms UV-Vis spectroscopy from a mysterious black box into a powerful analytical tool you can master and apply effectively.
Table of contents
- IntroductionWhy UV-Vis Spectroscopy Matters, How to Use This Book, Scope and Limitations of This GuideRead below
- Chapter 1: Fundamentals of Light and MatterProperties of Electromagnetic Radiation, Electronic Transitions and Energy Levels, How Molecules Absorb Light, Understanding Chromophores and Auxochromes
- Chapter 2: The Beer-Lambert Law and Quantitative AnalysisDeriving and Understanding the Beer-Lambert Law, Real-World Deviations and How to Handle Them, Determining Concentration from Absorbance, Building and Validating Calibration Curves
- Chapter 3: Instrument Design and ComponentsLight Sources: Deuterium and Tungsten Lamps, Wavelength Selection: Monochromators and Filters, Detectors and Signal Processing, Cuvettes, Optical Paths, and Optical Materials
- Chapter 4: Sample Preparation and HandlingChoosing the Right Solvent, Optimizing Sample Concentration, Proper Cuvette Handling and Cleaning, Ensuring Sample Stability and Preventing Degradation
- Chapter 5: Calibration, Validation, and Quality ControlBaseline Correction and Blank Measurements, Wavelength Calibration and Verification, Photometric Accuracy and Linearity Testing, Quality Assurance Protocols and Standards
- Chapter 6: Reading and Interpreting SpectraIdentifying Peaks and Absorption Bands, Selecting Analytical Wavelengths, Extracting Structural Information from Spectra, Comparing and Contrasting Spectra
- Chapter 7: Advanced Techniques and MeasurementsKinetic Measurements and Reaction Monitoring, Diode Array Detection and Multi-Wavelength Analysis, Derivative Spectroscopy for Enhanced Resolution, Difference Spectroscopy and Binding Studies
- Chapter 8: Troubleshooting Common ProblemsBaseline Drift and Noise Issues, Stray Light and Optical Artifacts, Temperature Effects and Environmental Factors, Identifying and Correcting Data Anomalies
- Chapter 9: Real-World Applications Across IndustriesPharmaceutical Quality Control and Drug Analysis, Environmental Testing and Water Quality, Materials Science and Polymer Analysis, Biochemical Assays and Protein Quantification
- Chapter 10: Data Analysis and ReportingStatistical Methods for Spectroscopic Data, Estimating Uncertainty and Error Propagation, Documentation, Reporting, and Compliance
- ConclusionKey Takeaways and Best Practices, Continuing Your Journey in Spectroscopy
- Glossary of Terms
- Further Reading and Resources
Introduction
Walk into almost any analytical laboratory in the world, and you will find a UV-Vis spectrophotometer sitting on the bench. It might be a compact single-beam unit in a university teaching lab, or a sophisticated double-beam system in a pharmaceutical quality control suite. Either way, the instrument is there because UV-Vis spectroscopy is one of the most reliable, cost-effective, and versatile analytical tools ever developed. It can tell you how much of a compound is present in a solution, whether a reaction has gone to completion, and even something about the structure of the molecule you are studying.
Yet despite its widespread use, UV-Vis spectroscopy is frequently misunderstood. Many scientists and technicians treat it as a simple "point and measure" technique: load the sample, press a button, read the number. That approach works well enough when conditions are ideal, but real-world samples are rarely ideal. Turbid solutions, interfering compounds, poorly cleaned cuvettes, and uncalibrated instruments can all produce results that look perfectly reasonable but are quietly, dangerously wrong. The gap between using a UV-Vis instrument and using it well is wider than most people realize.
This book was written to close that gap. Whether you are a graduate student running your first calibration curve, a research scientist troubleshooting unexpected absorbance readings, or a quality control analyst looking to strengthen your measurement protocols, the goal here is the same: to give you a clear, practical, and thorough understanding of UV-Vis spectroscopy that goes well beyond pressing buttons. You will learn the underlying science, the practical skills, and the critical thinking habits that separate reliable data from misleading results.
The chapters ahead move from foundational theory to hands-on practice and then into specialized applications. Each section builds on the last, so the concepts you encounter early in the book will pay dividends as you work through the more advanced material. Along the way, you will find concrete examples, decision-making frameworks, and troubleshooting guidance drawn from real analytical challenges. The aim is not just to explain how UV-Vis spectroscopy works, but to show you how to make it work for you, in your specific context, with your specific samples and goals.
Why UV-Vis Spectroscopy Matters
UV-Vis spectroscopy occupies a unique position in the analytical toolkit. Unlike many instrumental techniques, it is simultaneously simple in concept and rich in application. The core idea is straightforward: shine light of a specific wavelength through a sample, measure how much light is absorbed, and use that information to learn something useful about the sample. That simplicity is part of what makes the technique so enduring. Instruments are relatively affordable, measurements are fast, and the data are interpretable without specialized computational tools.
The range of problems that UV-Vis spectroscopy can address is genuinely impressive. In pharmaceutical laboratories, it is used to verify the identity and purity of active ingredients and to confirm that finished drug products contain the correct dose.[1] In environmental monitoring, it measures nitrate and nitrite concentrations in drinking water, tracks dissolved organic carbon in rivers, and detects trace pollutants in industrial effluents. In biochemistry, it quantifies proteins, nucleic acids, and enzyme activity. In materials science, it characterizes the optical properties of thin films, nanoparticles, and semiconductors. Few analytical techniques span such a wide range of disciplines with equal effectiveness.
The technique is also deeply connected to fundamental chemistry. When a molecule absorbs UV or visible light, it is not a random event. Specific electrons within the molecule are promoted to higher energy states, and the wavelengths at which this happens are determined by the molecule's electronic structure. This means that an absorption spectrum is not just a number; it is a fingerprint. Two compounds with different structures will generally absorb light differently, which is why UV-Vis spectroscopy can be used for both quantitative analysis (how much?) and qualitative identification (what is it?).
Speed is another major advantage. A full UV-Vis spectrum from 190 nm to 900 nm can be collected in seconds with a modern diode array instrument. Kinetic experiments that track how a reaction proceeds over time can be set up and running within minutes. This speed makes UV-Vis spectroscopy particularly valuable in high-throughput environments, such as drug discovery screening or routine quality control, where dozens or hundreds of samples may need to be analyzed each day.
It is also worth noting what UV-Vis spectroscopy does not require. Unlike nuclear magnetic resonance (NMR) spectroscopy, it does not need expensive superconducting magnets or highly trained operators. Unlike mass spectrometry, it does not destroy the sample or require complex ionization procedures. Unlike X-ray crystallography, it works with samples in solution rather than requiring crystalline solids. These practical advantages mean that UV-Vis spectroscopy is often the first technique a scientist reaches for when characterizing a new compound or monitoring a process.
Understanding UV-Vis spectroscopy well also builds intuition that transfers to other spectroscopic techniques. The concepts of electronic transitions, chromophores, and the relationship between molecular structure and light absorption are foundational ideas that appear throughout spectroscopy, photochemistry, and materials science. Mastering UV-Vis is not just about one instrument; it is about developing a way of thinking about how light and matter interact, which is one of the most productive frameworks in all of analytical science.
A practical example: Consider a pharmaceutical company releasing a batch of ibuprofen tablets. Before those tablets reach patients, the quality control team must confirm that each tablet contains the correct amount of active ingredient. UV-Vis spectroscopy, using a calibrated method validated against certified reference standards, can accomplish this measurement in under five minutes per sample. The same principle applies whether the sample is a tablet, a water sample from a river, or a protein solution in a research lab. The technique scales across contexts because the underlying science is universal.
The bottom line is that UV-Vis spectroscopy matters because it is fast, affordable, widely applicable, and grounded in fundamental science. But it only delivers on that promise when it is used correctly. That is exactly what this book is designed to help you do.
How to Use This Book
This book is organized to serve two types of readers. The first is someone who wants to build a solid foundation from the ground up, working through the material in sequence from Chapter 1 to Chapter 10. The second is someone who already has practical experience with UV-Vis spectroscopy and wants to fill specific gaps, whether that means understanding the Beer-Lambert Law more deeply, improving sample preparation, or learning how to troubleshoot baseline drift. Both approaches are valid, and the book is structured to support both.
Here is a brief map of what each part of the book covers, so you can navigate efficiently:
- Chapters 1 and 2 cover the foundational science: how light interacts with matter, what electronic transitions are, how chromophores work, and how the Beer-Lambert Law connects absorbance to concentration. If you are new to spectroscopy or want to strengthen your theoretical grounding, start here.
- Chapter 3 explains how UV-Vis instruments are built, covering light sources, monochromators, detectors, and cuvettes. Understanding your instrument helps you make better decisions about how to use it and how to interpret its limitations.
- Chapters 4 and 5 focus on practical skills: preparing samples correctly, choosing solvents, handling cuvettes, calibrating instruments, and running quality control checks. These chapters are especially valuable for anyone setting up a new method or troubleshooting inconsistent results.
- Chapter 6 teaches you how to read and interpret spectra, including how to identify peaks, select analytical wavelengths, and extract structural information from absorption patterns.
- Chapter 7 introduces advanced techniques such as kinetic measurements, diode array detection, derivative spectroscopy, and difference spectroscopy. These methods expand what UV-Vis can do beyond simple concentration measurements.
- Chapter 8 is a dedicated troubleshooting guide covering the most common problems encountered in UV-Vis analysis, from baseline drift and stray light to temperature effects and data anomalies.
- Chapter 9 explores real-world applications across pharmaceutical analysis, environmental monitoring, materials science, and biochemistry, showing how the principles from earlier chapters play out in specific professional contexts.
- Chapter 10 addresses data analysis and reporting, including statistical methods, uncertainty estimation, and documentation practices for regulatory compliance.
If you are a student or early-career scientist, the recommended path is to read Chapters 1 through 6 in order before dipping into the later chapters based on your specific needs. If you are an experienced analyst, you might start with Chapter 5 on calibration and validation, then use Chapter 8 as a reference when problems arise. Chapter 9 is particularly useful if you are moving into a new application area and want a quick orientation to how UV-Vis is used in that field.
Throughout the book, you will encounter several recurring features designed to make the content more useful in practice. Worked examples walk through real calculations and measurement scenarios step by step. Decision frameworks help you choose between options, such as which solvent to use or which wavelength to select for a given analysis. Troubleshooting checklists give you a structured way to diagnose problems when results do not look right. Caution notes highlight common mistakes and how to avoid them.
One important piece of advice: do not skip the theory chapters even if you are primarily interested in practical applications. The theory is not there to be academic for its own sake. Understanding why the Beer-Lambert Law has limits, or why certain solvents interfere with UV measurements, directly informs how you design experiments and interpret results. Scientists who understand the underlying principles make better decisions at the bench than those who follow protocols without understanding them.
The glossary at the back of the book defines key terms as they are used in UV-Vis spectroscopy. When you encounter an unfamiliar term in the text, the glossary is a quick reference. The further reading section points you toward primary literature, standard methods, and advanced texts if you want to go deeper on any particular topic. This book is designed to be a strong foundation, not an endpoint.
Suggested reading paths by role:
- Graduate student or new analyst: Read sequentially, Chapters 1 through 10.
- Experienced researcher troubleshooting problems: Start with Chapter 8, then revisit Chapters 4 and 5 as needed.
- Quality control professional: Focus on Chapters 2, 5, and 10, with Chapter 9 for application-specific context.
- Materials scientist or biochemist: Chapters 1, 6, 7, and 9 will be most directly relevant.
However you choose to navigate the book, the goal is the same: to leave you with a confident, practical command of UV-Vis spectroscopy that you can apply immediately in your work. The concepts build on each other, so even if you jump around, returning to earlier chapters when a concept feels unclear will almost always be worth the time.
Scope and Limitations of This Guide
Every book has boundaries, and being clear about those boundaries upfront saves confusion later. This guide focuses specifically on ultraviolet-visible (UV-Vis) spectroscopy in the wavelength range of approximately 190 nm to 900 nm. This range covers the near-ultraviolet (190 to 400 nm) and the visible spectrum (400 to 700 nm), along with a portion of the near-infrared (700 to 900 nm) that many UV-Vis instruments can access. The physics, instrumentation, and analytical methods discussed here are specific to this region of the electromagnetic spectrum.
This book does not cover infrared (IR) spectroscopy, Raman spectroscopy, fluorescence spectroscopy, or atomic absorption spectroscopy in any depth. These are related but distinct techniques with their own instrumentation, theory, and applications. Where relevant, brief comparisons are made to help you understand how UV-Vis fits into the broader landscape of analytical spectroscopy, but those comparisons are illustrative rather than comprehensive. If you need a detailed treatment of IR or fluorescence spectroscopy, dedicated texts on those subjects will serve you better.
The book assumes a foundational level of chemistry and physics knowledge. Specifically, it assumes you are comfortable with:
- Basic concepts in general chemistry, including atomic structure, molecular bonding, and solution chemistry
- Elementary physics concepts such as wavelength, frequency, and the electromagnetic spectrum
- Introductory mathematics, including logarithms, linear equations, and basic statistics
- Familiarity with laboratory practices such as preparing solutions, using volumetric glassware, and following standard operating procedures
If any of those areas feel shaky, a brief review of the relevant concepts before starting Chapter 1 will make the material much easier to follow. The book does not assume prior experience with UV-Vis instruments specifically, so no background in spectroscopy is required. However, readers who already have some hands-on experience will find that the theoretical sections give new meaning to things they have observed at the bench.
It is also important to be clear about what this book is not. It is not a regulatory compliance manual, though it does discuss quality assurance practices and references relevant standards such as those from the United States Pharmacopeia (USP) and the International Organization for Standardization (ISO). Regulatory requirements vary by industry, country, and application, and they change over time. Always consult the current version of the applicable standard or guideline for your specific regulatory context.[2] This book provides the scientific and practical foundation that makes compliance possible, but it does not substitute for the specific requirements of your regulatory environment.
Similarly, this book does not provide method validation protocols for specific compounds or matrices. Method validation is a rigorous process that depends heavily on the specific analyte, sample type, instrument, and intended use of the data. What this book does provide is the conceptual framework and practical skills that make method development and validation more effective. You will understand why certain validation parameters matter, how to design experiments to assess them, and how to interpret the results.
The instrument-specific guidance in this book is intentionally general. UV-Vis spectrophotometers are made by many manufacturers, including Agilent, Shimadzu, PerkinElmer, Thermo Fisher Scientific, and JASCO, among others. Each instrument has its own software interface, menu structure, and specific operating procedures. Rather than describing any one instrument in detail, this book focuses on the underlying principles and practices that apply across all UV-Vis instruments. Your instrument's user manual is the right resource for model-specific operating instructions; this book is the resource for understanding what those instructions mean and why they matter.
One final note on scope: UV-Vis spectroscopy is a mature technique with a rich scientific literature going back more than a century. This book draws on that literature to provide accurate, well-grounded content, but it is not an exhaustive academic review. The goal is practical mastery, not encyclopedic coverage. Where a concept is introduced at a level sufficient for practical application, deeper theoretical treatments are pointed to in the further reading section for those who want to go further. The balance throughout is between depth and accessibility, always in service of helping you do better analytical work.
What this book covers and what it does not:
- Covered: UV-Vis theory, Beer-Lambert Law, instrument components, sample preparation, calibration, spectral interpretation, advanced UV-Vis techniques, troubleshooting, applications across industries, data analysis and reporting
- Not covered in depth: IR spectroscopy, Raman spectroscopy, fluorescence spectroscopy, atomic absorption spectroscopy, specific regulatory compliance procedures, instrument-specific operating instructions, compound-specific method validation protocols
With those boundaries clearly defined, you can approach the material ahead with realistic expectations and a clear sense of how it fits into your broader analytical work. UV-Vis spectroscopy is a powerful technique, and this book is designed to help you use that power with precision, confidence, and a thorough understanding of what your data actually means. That is a goal worth pursuing, and the chapters ahead are built to help you get there.
Notes
Introduction
This is the end of the free sample. The full book has 10 chapters.
Want this book written for you?
Tell us your goals and background, and get your own version of this book, tailored by AI to you.


Benefits of AI-tailored books
- Read one book, not ten:
- all the Spectroscopy knowledge you need, gathered into a single book.
- Save days of learning:
- tell us your goals, choose your topics, and the whole book is built around them.
- Learn effortlessly:
- Spectroscopy book written for your specific background and expertise.
- Understand at a glance:
- includes charts, tables, timelines, checklists, decision trees, and more.
- Stay current:
- written the day you order it, not years ago.
- Trust what you read:
- every book is checked for accuracy, with real research when your subject needs it.
Create your unique book in 3 steps
- 1. Select your focus
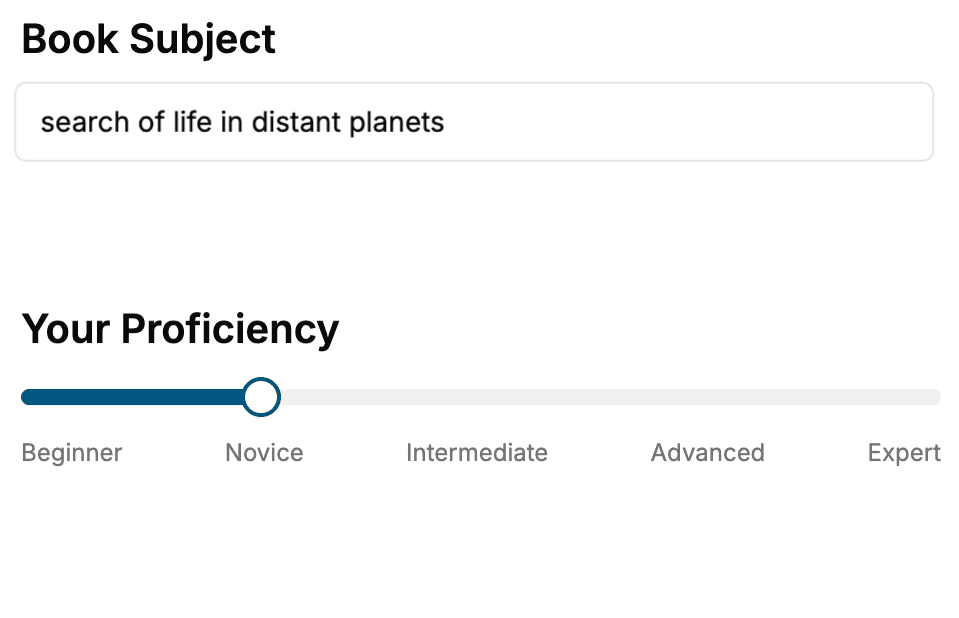
Select the focus of your Spectroscopy book and share your background
- 2. Personalize your book
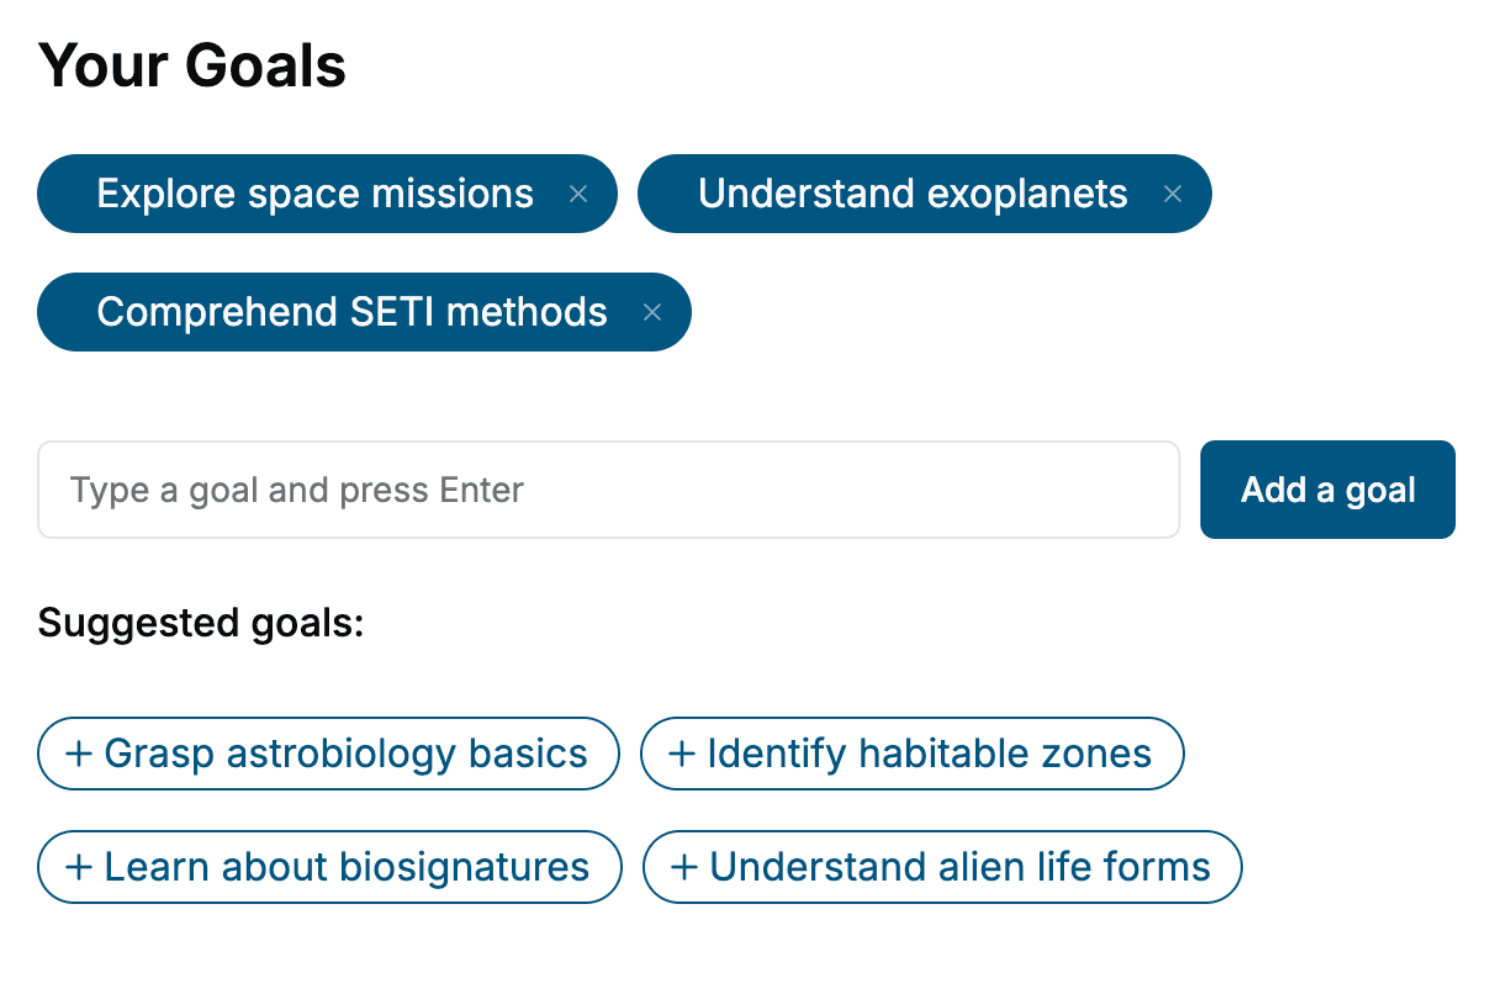
Specify your goals and choose sub-topics to include
- 3. Get your tailored book
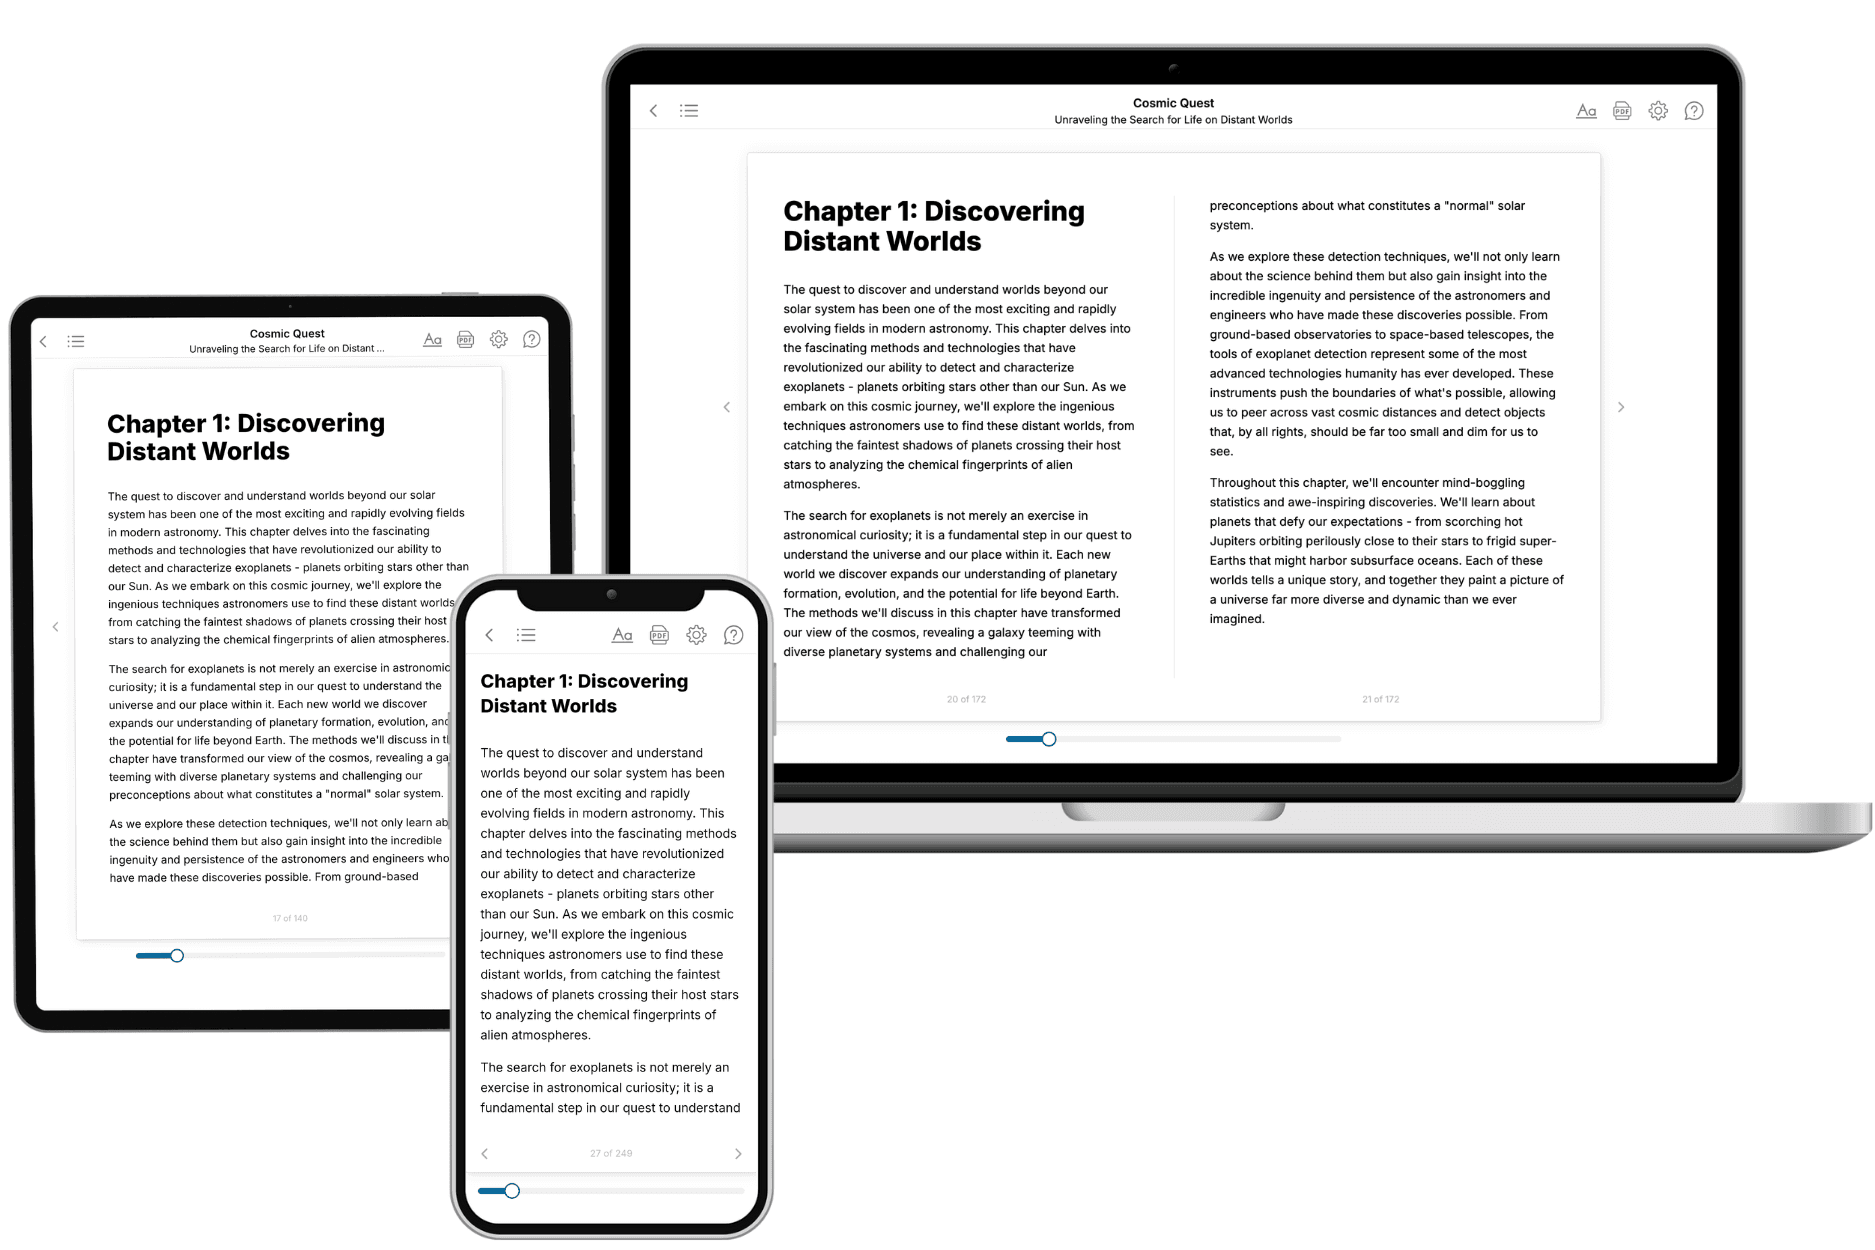
Your book is ready in 10 minutes. Read it online, download as EPUB or PDF, or send to Kindle.
Frequently asked questions
- What is TailoredRead?
TailoredRead creates complete, full-length nonfiction ebooks, written specifically for you. Tell us what you want to learn and why, and TailoredRead writes you a complete ebook on it, with charts, tables, and diagrams throughout. Read it online, on Kindle, or on any e-reader, or download it as a PDF or EPUB. Every book is written fresh the day you order it.
- How is the book tailored to me?
Before anything is written, you answer a few short questions about your goals, your background, and the topics you care about. Your book is then planned around your answers: written at your level, focused on your goals, and covering the topics you chose, instead of the one-size-fits-all book a store sells everyone.
- Will it read like generic AI content?
No. Your book isn't a chat transcript: it's planned chapter by chapter before a single word is written, told in a clear book voice, and explains ideas visually with charts, tables, and diagrams. After writing, every book goes through an editorial pass that polishes chapters so the book reads consistent from start to finish. Judge for yourself: browse thousands of sample books on our Explore Books page.
- How accurate is the content?
Our AI first checks whether your subject needs live research. Niche and fast-moving subjects are researched before writing, and the book plan and chapters are grounded in what it finds. After writing, every book goes through a quality pass that checks its facts and consistency, and researched books list their sources in a Notes section at the back.
- How long is the book?
You choose the length: Comprehensive (250-300 pages), Detailed (150-200 pages), Essential (70-100 pages), or Short (30-50 pages).
- Does the book include visuals?
Yes. Every book includes charts, tables, and diagrams: timelines, checklists, step-by-step guides, decision trees, comparison tables, matrices, and bar charts. A typical book includes dozens of these visual elements.
- Can I read it on Kindle? What formats can I download?
Yes. Every book can be read in our online reader or downloaded as a PDF or EPUB. The EPUB can be opened with Kindle, Apple Books, Kobo, and any e-reader. The Commercial and Author licenses also include an editable Word (DOCX) and Markdown download.
- How much does it cost?
About the price of a regular ebook. The exact price depends on your book's length and complexity, from $2 for the shortest books to $35 for the most comprehensive, and it's shown when you review your book, before you commit to anything. Each book is a one-time purchase, yours to keep, no subscription. Licenses that let you share, teach, or publish your book range from $35.99 to $49.99.
- Can I preview the book before purchasing?
Before you pay, you'll see what your book will cover: the title, a detailed description, the estimated length, and the complete chapter-by-chapter table of contents, so you know what you're getting before you decide. The full text itself is written after you purchase.
- How long does it take to create a book?
About 10 minutes. You can start reading the opening chapters while the rest is still being written.