UV-Visible Spectroscopy Essentials
Master the Fundamentals and Applications of Light-Based Chemical Analysis
Many chemists and laboratory professionals struggle with UV-Visible spectroscopy because they've learned only the theory without understanding how to apply it effectively in real-world settings.
222 pages10 chaptersJan 18, 2026Spectroscopy
About this book
This book bridges that gap by combining essential theoretical foundations with practical, hands-on guidance you can immediately implement in your laboratory. You'll discover how to select the right wavelengths for your analysis, prepare samples correctly, calibrate instruments properly, and troubleshoot common problems that plague spectroscopic measurements. Whether you're analyzing pharmaceutical compounds, monitoring environmental contaminants, or characterizing new materials, this guide provides the knowledge and confidence you need to generate reliable, reproducible results. From understanding the Beer-Lambert Law's real-world limitations to mastering advanced detection techniques, you'll develop a complete toolkit for UV-Visible spectroscopy. This book transforms spectroscopy from a mysterious black box into a transparent, controllable analytical tool that delivers the insights your research demands.
Table of contents
- IntroductionWhy UV-Visible Spectroscopy Matters in Modern Chemistry, What You'll Learn in This Book, How to Use This Guide for Maximum BenefitRead below
- Chapter 1: Fundamentals of Light and Matter InteractionThe Electromagnetic Spectrum and UV-Visible Region, Photon Energy and Wavelength Relationships, How Molecules Absorb Light: Electronic Transitions, Chromophores and Auxochromes: The Basis of Color
- Chapter 2: The Beer-Lambert Law and Quantitative AnalysisUnderstanding the Beer-Lambert Law Equation, Absorbance Versus Transmittance: Which to Use, Real-World Limitations and Deviations from the Law, Converting Absorbance to Concentration Accurately
- Chapter 3: Instrumentation and Optical ComponentsLight Sources: Deuterium, Tungsten, and LED Options, Wavelength Selection: Filters, Monochromators, and Gratings, Detectors: Photomultiplier Tubes and Photodiodes, The Complete Optical Path and Signal Processing
- Chapter 4: Sample Preparation and HandlingChoosing the Right Cuvette Material and Path Length, Proper Sample Preparation Techniques, Solvent Selection and Its Impact on Measurements, Temperature Control and Environmental Factors
- Chapter 5: Calibration, Validation, and Quality ControlWavelength Calibration Using Reference Standards, Absorbance Calibration and Baseline Correction, Implementing Quality Control Procedures, Validation Methods for Analytical Methods
- Chapter 6: Pharmaceutical and Clinical ApplicationsDrug Assay and Purity Determination, Dissolution Testing and Bioavailability Studies, Clinical Chemistry and Biomarker Detection
- Chapter 7: Environmental and Food AnalysisWater Quality Monitoring and Contaminant Detection, Food Safety and Nutritional Analysis, Detecting Environmental Pollutants and Heavy Metals
- Chapter 8: Advanced Techniques and Specialized MethodsDiode Array Detection and Multi-Wavelength Analysis, Kinetic Measurements and Reaction Monitoring, Derivative Spectroscopy for Enhanced Resolution, Fiber Optic Probes and Remote Sensing
- Chapter 9: Troubleshooting and Common ProblemsIdentifying and Minimizing Stray Light, Addressing Baseline Drift and Noise Issues, Diagnosing Sample-Related Problems, Preventive Maintenance and Instrument Care
- Chapter 10: Data Analysis and InterpretationInterpreting Spectral Features and Peak Identification, Quantitative Analysis Using Calibration Curves, Statistical Methods for Data Evaluation
- ConclusionKey Takeaways for Successful Spectroscopy, Future Directions in UV-Visible Spectroscopy
- Glossary of Terms
- Further Reading and Resources
Introduction
UV-Visible spectroscopy stands as one of the most widely used analytical techniques in modern chemistry laboratories, yet many professionals struggle to bridge the gap between theoretical knowledge and practical application. You might understand that molecules absorb light at specific wavelengths, but translating that concept into reliable concentration measurements or troubleshooting unexpected results requires a deeper, more nuanced understanding. This book addresses that challenge directly by combining essential theoretical foundations with actionable guidance you can implement immediately in your laboratory work. Whether you're analyzing pharmaceutical compounds, monitoring environmental samples, or characterizing new materials, the principles and practices covered here will transform how you approach spectroscopic analysis.
The power of UV-Visible spectroscopy lies in its versatility and accessibility. Unlike more complex analytical techniques that require extensive sample preparation or specialized expertise, spectroscopy offers relatively straightforward measurements that can provide both qualitative identification and quantitative concentration data. A single instrument can determine drug purity in pharmaceutical quality control, measure protein concentrations in biochemistry research, detect pollutants in water samples, and characterize nanomaterials in materials science. This broad applicability explains why spectrophotometers occupy bench space in virtually every chemistry laboratory worldwide. However, this apparent simplicity can be deceptive—obtaining truly reliable results requires understanding the instrument's capabilities and limitations, recognizing potential sources of error, and implementing proper quality control procedures.
Throughout this guide, you'll discover that successful spectroscopy depends less on expensive equipment and more on systematic methodology and critical thinking. The difference between mediocre results and excellent data often comes down to seemingly small details: selecting the appropriate wavelength, preparing samples correctly, recognizing when the Beer-Lambert Law's assumptions break down, or identifying the source of baseline drift. These practical skills develop through understanding not just what to do, but why certain approaches work while others fail. By the time you complete this book, you'll possess both the conceptual framework and the practical toolkit necessary to generate reproducible, defensible spectroscopic data that advances your research or quality control objectives.
Why UV-Visible Spectroscopy Matters in Modern Chemistry
UV-Visible spectroscopy has maintained its position as a cornerstone analytical technique for over seven decades because it addresses fundamental questions that chemists ask daily: What is this substance? and How much of it is present? The technique measures how molecules interact with electromagnetic radiation in the ultraviolet and visible regions of the spectrum, typically spanning wavelengths from approximately 190 to 800 nanometers. When light passes through a sample, molecules absorb photons at specific wavelengths corresponding to their electronic structure, creating a characteristic absorption pattern that serves as a molecular fingerprint. This absorption also follows predictable mathematical relationships that allow you to calculate concentrations with remarkable precision when proper procedures are followed.
The pharmaceutical industry relies heavily on UV-Visible spectroscopy for quality control and regulatory compliance. Consider a typical drug manufacturing scenario: a pharmaceutical company produces tablets containing 500 milligrams of an active ingredient. Before releasing these tablets to market, quality control laboratories must verify that each batch contains the correct amount of active compound within strict tolerances, often ±5% or tighter. UV-Visible spectroscopy provides a rapid, non-destructive method to measure drug content by dissolving tablets in appropriate solvents and measuring absorbance at characteristic wavelengths. A single analyst can process dozens of samples per day, generating data that meets regulatory requirements from agencies like the FDA or EMA[1]. This combination of speed, accuracy, and regulatory acceptance makes spectroscopy indispensable in pharmaceutical analysis.
Environmental monitoring represents another critical application domain where spectroscopy delivers unique value. Water treatment facilities routinely measure parameters like nitrate concentration, total organic carbon, and heavy metal content using spectroscopic methods. For example, nitrate contamination in drinking water poses serious health risks, particularly for infants, with regulatory limits typically set at 10 milligrams per liter as nitrogen. Spectroscopic methods can detect nitrate at concentrations well below this threshold by measuring absorbance at 220 nanometers, with appropriate corrections for organic matter interference. The ability to perform these measurements quickly and inexpensively enables continuous monitoring that protects public health. A single spectrophotometer in a water treatment plant might perform thousands of measurements annually, providing the data necessary to ensure compliance with environmental regulations.
Beyond these established applications, UV-Visible spectroscopy continues to evolve and find new uses in emerging fields. Nanomaterial characterization increasingly relies on spectroscopic techniques to determine particle size and concentration of gold nanoparticles, quantum dots, and other nanoscale materials. The surface plasmon resonance of gold nanoparticles, for instance, produces characteristic absorption peaks whose position and intensity depend on particle size and aggregation state. Researchers developing new drug delivery systems or diagnostic tools use these spectroscopic signatures to monitor nanoparticle synthesis and stability. Similarly, the growing field of personalized medicine employs spectroscopy for rapid biomarker detection in clinical samples, potentially enabling point-of-care diagnostics that deliver results in minutes rather than hours or days.
The economic advantages of UV-Visible spectroscopy contribute significantly to its widespread adoption. Compared to techniques like mass spectrometry or nuclear magnetic resonance spectroscopy, spectrophotometers require relatively modest capital investment, with quality instruments available at price points ranging from a few thousand dollars for basic models to approximately fifty thousand dollars for high-end research systems. Operating costs remain low because the technique requires no consumable gases, generates minimal waste, and demands little specialized maintenance beyond periodic lamp replacement and wavelength calibration. This favorable cost profile makes spectroscopy accessible to laboratories with limited budgets, from academic teaching labs to small contract testing facilities. The return on investment becomes apparent quickly when you consider that a single instrument can support multiple analytical methods across diverse sample types.
Perhaps most importantly, UV-Visible spectroscopy offers an excellent entry point for developing broader analytical chemistry skills. The technique teaches fundamental concepts that transfer to other spectroscopic methods: understanding how electromagnetic radiation interacts with matter, recognizing the importance of proper calibration, appreciating the relationship between signal and noise, and developing systematic troubleshooting approaches. Students and early-career professionals who master UV-Visible spectroscopy build a conceptual foundation that facilitates learning more complex techniques like infrared spectroscopy, fluorescence spectroscopy, or atomic absorption spectroscopy. The skills you develop—critical evaluation of data quality, recognition of instrumental artifacts, and systematic method optimization—apply across the entire spectrum of analytical chemistry. This pedagogical value ensures that spectroscopy will remain central to chemistry education and professional development for the foreseeable future.
The regulatory landscape further reinforces spectroscopy's importance in modern chemistry. Pharmacopeias worldwide, including the United States Pharmacopeia (USP), European Pharmacopoeia (Ph. Eur.), and Japanese Pharmacopoeia (JP), include hundreds of monographs specifying UV-Visible spectroscopic methods for drug identification and quantification. Environmental regulations similarly reference spectroscopic methods as standard procedures for monitoring water quality, air pollutants, and soil contamination. When regulatory agencies specify particular analytical methods, laboratories must implement those methods to demonstrate compliance. This regulatory framework creates a self-reinforcing cycle: spectroscopy remains important because regulations require it, and regulations continue to specify spectroscopic methods because the technique's reliability and widespread availability make it practical for enforcement purposes. Understanding this regulatory context helps you appreciate why mastering spectroscopy represents more than academic interest—it's often a professional necessity.
What You'll Learn in This Book
This book follows a carefully structured progression that builds your understanding from fundamental principles through advanced applications and troubleshooting. You'll begin by exploring how light and matter interact at the molecular level, understanding why certain molecules absorb specific wavelengths while remaining transparent to others. This foundation proves essential because spectroscopy ultimately depends on electronic transitions within molecules—without grasping these underlying mechanisms, you're left following procedures mechanically without understanding when they might fail or how to adapt them to new situations. The early chapters establish this conceptual framework while maintaining focus on practical implications rather than abstract quantum mechanics.
The Beer-Lambert Law receives extensive treatment because it represents the mathematical heart of quantitative spectroscopy. You'll learn not just the equation A = εbc (where A is absorbance, ε is molar absorptivity, b is path length, and c is concentration), but more importantly, when this relationship holds and when it breaks down. Real-world samples frequently violate the law's assumptions through phenomena like:
- Chemical deviations: Association, dissociation, or solvent interactions that change the absorbing species
- Instrumental deviations: Stray light, polychromatic radiation, or detector nonlinearity
- Concentration-dependent deviations: High absorbance values where detector response becomes nonlinear
- Matrix effects: Other sample components that interfere with measurements
Instrumentation chapters demystify the spectrophotometer by examining each optical component and its function. You'll discover why deuterium lamps provide UV radiation while tungsten lamps serve the visible region, how monochromators isolate specific wavelengths using diffraction gratings, and why detector choice affects sensitivity and wavelength range. This knowledge transforms the instrument from a mysterious black box into a comprehensible system of optical components. When problems arise—perhaps your absorbance readings seem unusually noisy or your baseline drifts unpredictably—understanding the optical path helps you diagnose whether the issue stems from the light source, monochromator, sample compartment, or detector. Modern instruments increasingly incorporate advanced features like diode array detectors that capture entire spectra simultaneously, and understanding these technologies helps you leverage their capabilities effectively.
Sample preparation receives detailed attention because this step often determines whether your measurements succeed or fail. You'll learn systematic approaches for selecting appropriate solvents, choosing cuvette materials and path lengths, and preparing samples that fall within the optimal absorbance range. Consider a practical example: you need to measure the concentration of a protein solution. If you simply place the undiluted sample in a standard 1-centimeter cuvette, the absorbance might exceed 2.0, pushing you into a region where the Beer-Lambert Law breaks down and detector response becomes nonlinear. Proper sample preparation involves calculating an appropriate dilution factor to bring absorbance into the optimal range of 0.2 to 0.8, selecting a cuvette material transparent at your measurement wavelength (quartz for UV, glass or plastic for visible), and ensuring temperature control if your analyte's absorption characteristics are temperature-sensitive. These seemingly mundane details separate reliable results from questionable data.
Calibration and quality control procedures form a critical component of the book because regulatory compliance and scientific rigor demand documented evidence of measurement reliability. You'll learn step-by-step procedures for:
- Performing wavelength calibration using holmium oxide or other reference standards
- Verifying absorbance accuracy with certified reference materials
- Establishing baseline correction procedures that account for solvent absorption and instrumental drift
- Constructing calibration curves with appropriate concentration ranges and statistical evaluation
- Implementing quality control samples that detect systematic errors or instrument malfunction
- Documenting all procedures and results to meet regulatory requirements
Application-focused chapters demonstrate how spectroscopic principles apply to real-world analytical challenges across pharmaceutical, environmental, food, and materials analysis. Rather than presenting generic theory, these sections provide specific examples with actual wavelengths, concentration ranges, and potential interferences. For pharmaceutical applications, you'll see how dissolution testing monitors drug release rates from tablets, why wavelength selection matters for analyzing multi-component formulations, and how to validate methods according to ICH guidelines[2]. Environmental applications cover standard methods for water quality parameters, strategies for minimizing matrix interferences in complex samples, and field-portable instruments for on-site analysis. These concrete examples help you transfer knowledge to your specific analytical needs.
Advanced techniques chapters expand your capabilities beyond simple absorbance measurements. Diode array detection allows you to capture complete spectra in seconds, enabling peak purity assessment and multi-component analysis without physical separation. Kinetic measurements transform the spectrophotometer into a reaction monitoring tool, useful for enzyme assays and chemical kinetics studies. Derivative spectroscopy enhances resolution by mathematically processing spectra to reveal overlapping peaks or subtle features. Fiber optic probes enable remote sensing in hazardous environments or process monitoring in industrial settings. Each technique receives practical treatment focusing on when to use it, how to implement it, and what advantages it offers over conventional approaches. You'll learn not just that these capabilities exist, but how to evaluate whether they address your specific analytical challenges.
The troubleshooting chapter provides systematic diagnostic approaches for common problems that plague spectroscopic measurements. When you encounter unexpected results, random guessing wastes time and resources. Instead, you'll learn structured troubleshooting that considers potential causes systematically:
This systematic approach applies to various problems including stray light, sample-related issues, and instrument malfunctions, helping you resolve issues efficiently rather than through trial and error.Problem: Baseline drift during measurement
Potential causes: Temperature fluctuations, lamp instability, electronic noise, solvent evaporation
Diagnostic steps: Check temperature control, verify lamp warm-up time, examine electrical connections, ensure cuvette sealing
Solutions: Allow adequate warm-up, implement temperature control, replace aging lamp, use sealed cuvettes
Data analysis and interpretation chapters teach you to extract maximum information from spectroscopic measurements while recognizing data quality limitations. You'll learn to construct and evaluate calibration curves using appropriate statistical methods, calculate limits of detection and quantification, assess measurement uncertainty, and present results with proper significant figures and confidence intervals. These skills prove essential when defending your data to supervisors, regulatory inspectors, or peer reviewers. Understanding statistics also helps you design experiments efficiently, determining how many replicates provide adequate precision or whether observed differences between samples represent real effects or random variation. The goal is developing critical thinking skills that allow you to evaluate data quality objectively rather than accepting results uncritically.
How to Use This Guide for Maximum Benefit
This book is designed to serve multiple purposes depending on your current needs and experience level. If you're new to UV-Visible spectroscopy or returning after time away from the technique, reading sequentially from beginning to end provides the most comprehensive learning experience. The chapters build progressively, with later material assuming familiarity with concepts introduced earlier. However, if you're an experienced practitioner facing a specific challenge—perhaps troubleshooting an instrument problem or validating a new method—you can jump directly to relevant chapters. The detailed table of contents and cross-references throughout the text facilitate this targeted approach. Each chapter stands relatively independently while providing connections to related material elsewhere in the book.
To maximize learning effectiveness, actively engage with the material rather than passively reading. When you encounter a new concept or procedure, consider how it applies to your specific analytical work. If the text describes wavelength selection criteria, think about the compounds you analyze and what wavelengths might be appropriate. When calibration procedures are explained, compare them to your current practices and identify potential improvements. This active processing transforms abstract information into practical knowledge you can apply immediately. Consider keeping a notebook where you record insights, questions, or ideas for implementing new approaches in your laboratory. This documentation creates a personalized reference that complements the book's content.
The examples and case studies throughout the book deserve special attention because they illustrate how principles apply in practice. Rather than skimming these sections, work through them carefully, verifying calculations and considering alternative approaches. For instance, when a calibration curve example is presented, examine the data points and consider:
- Does the concentration range seem appropriate for the analytical question?
- Are there enough calibration points to define the relationship reliably?
- Do any points appear to be outliers that might indicate preparation errors?
- Is the correlation coefficient adequate for the intended application?
- What would happen if you extended the calibration range higher or lower?
Hands-on practice remains essential for developing true competence in spectroscopy. Reading about proper cuvette handling doesn't substitute for actually cleaning cuvettes, filling them without introducing bubbles, and positioning them correctly in the sample compartment. If you have access to a spectrophotometer, use it to verify concepts from the book. Prepare a simple calibration curve for a colored compound like potassium permanganate or copper sulfate. Deliberately introduce errors—use a dirty cuvette, create bubbles, or measure at a non-optimal wavelength—and observe how these mistakes affect your results. This experiential learning cements understanding far more effectively than passive reading. If you lack instrument access currently, seek opportunities through your institution, employer, or professional networks to gain practical experience.
The book includes numerous references to scientific literature, regulatory guidelines, and technical resources. These citations serve multiple purposes beyond simply documenting sources. They provide pathways for deeper exploration of topics that particularly interest you or relate closely to your work. If you're involved in pharmaceutical analysis, for example, consulting the ICH validation guidelines referenced in the calibration chapter will provide additional context and requirements beyond what this book covers. Similarly, if you work with environmental samples, examining EPA methods for specific analytes will show how the general principles discussed here apply to standardized regulatory procedures. Building a personal library of key references creates a knowledge base that extends well beyond this single volume.
Consider forming or joining a study group or professional learning community focused on analytical chemistry. Discussing concepts with colleagues reinforces understanding and exposes you to different perspectives and applications. Someone working in pharmaceutical quality control faces different challenges than an environmental chemist or materials scientist, yet all use fundamentally similar spectroscopic principles. These diverse viewpoints enrich learning and often reveal creative solutions to common problems. Professional organizations like the American Chemical Society, Royal Society of Chemistry, or local analytical chemistry groups provide networking opportunities and continuing education resources that complement this book's content. Many offer webinars, workshops, or conferences specifically addressing spectroscopic techniques.
As you progress through the book, periodically review earlier chapters to reinforce learning and recognize connections you might have missed initially. Concepts that seemed abstract during first reading often become clearer after you've seen their practical applications in later chapters. For example, the discussion of electronic transitions in Chapter 1 might seem purely theoretical initially, but after working through pharmaceutical applications in Chapter 6, you'll better appreciate why certain drug molecules absorb at specific wavelengths. This iterative review process, sometimes called spiral learning, produces deeper understanding than single-pass reading. Schedule regular review sessions, perhaps monthly, to revisit key chapters and assess how your understanding has evolved.
Keep the book accessible in your laboratory or workspace as a reference resource. When you encounter unexpected results or need to implement a new procedure, having immediate access to relevant information proves invaluable. Consider using sticky notes or tabs to mark sections you reference frequently, creating a personalized quick-reference system. Some readers find it helpful to create summary sheets or flowcharts for common procedures like instrument calibration or troubleshooting, condensing the book's detailed explanations into concise guides for routine use. These personalized resources complement rather than replace the full text, providing quick reminders while the complete explanations remain available when needed.
Finally, recognize that mastering UV-Visible spectroscopy is an ongoing process rather than a destination. Even experienced spectroscopists encounter new challenges, unfamiliar sample types, or evolving instrumental capabilities that require continued learning. Approach this book as the beginning of your spectroscopy journey rather than its conclusion. The fundamental principles remain constant, but applications, instrumentation, and best practices continue evolving. Stay current by reading analytical chemistry journals, attending professional development opportunities, and engaging with the broader scientific community. The solid foundation this book provides will serve you throughout your career, enabling you to adapt to new challenges and opportunities as they arise. Your investment in understanding spectroscopy deeply rather than superficially will pay dividends through more reliable data, more efficient troubleshooting, and greater confidence in your analytical capabilities.
Notes
Introduction
- 1. United States Food and Drug Administration, Analytical Procedures and Methods Validation for Drugs and Biologics, FDA Guidance for Industry, 2015
- 2. International Council for Harmonisation, Validation of Analytical Procedures: Text and Methodology Q2(R1), ICH Harmonised Tripartite Guideline, 2005
This is the end of the free sample. The full book has 10 chapters.
Want this book written for you?
Tell us your goals and background, and get your own version of this book, tailored by AI to you.


Benefits of AI-tailored books
- Read one book, not ten:
- all the Spectroscopy knowledge you need, gathered into a single book.
- Save days of learning:
- tell us your goals, choose your topics, and the whole book is built around them.
- Learn effortlessly:
- Spectroscopy book written for your specific background and expertise.
- Understand at a glance:
- includes charts, tables, timelines, checklists, decision trees, and more.
- Stay current:
- written the day you order it, not years ago.
- Trust what you read:
- every book is checked for accuracy, with real research when your subject needs it.
Create your unique book in 3 steps
- 1. Select your focus
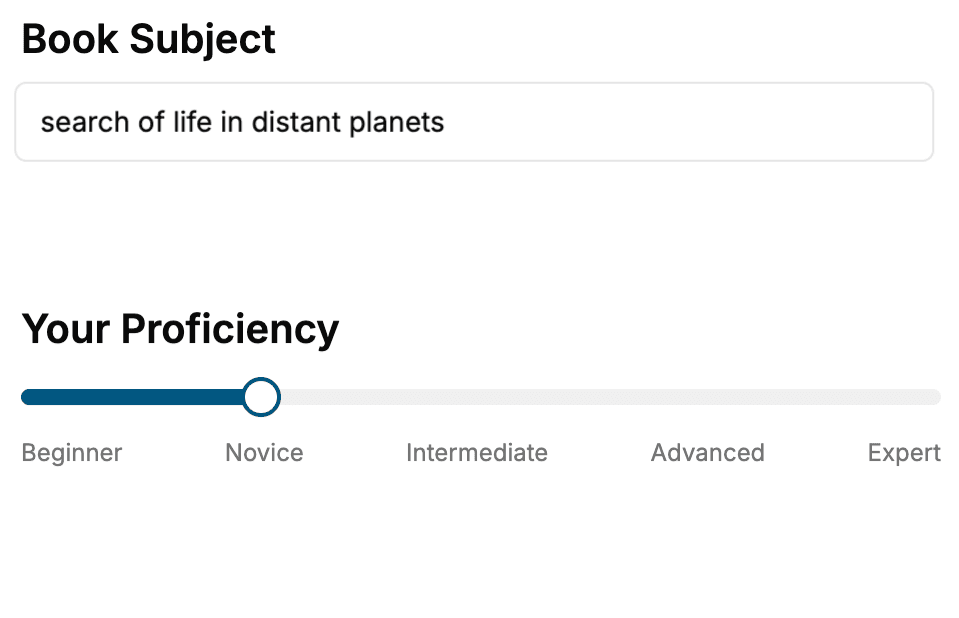
Select the focus of your Spectroscopy book and share your background
- 2. Personalize your book
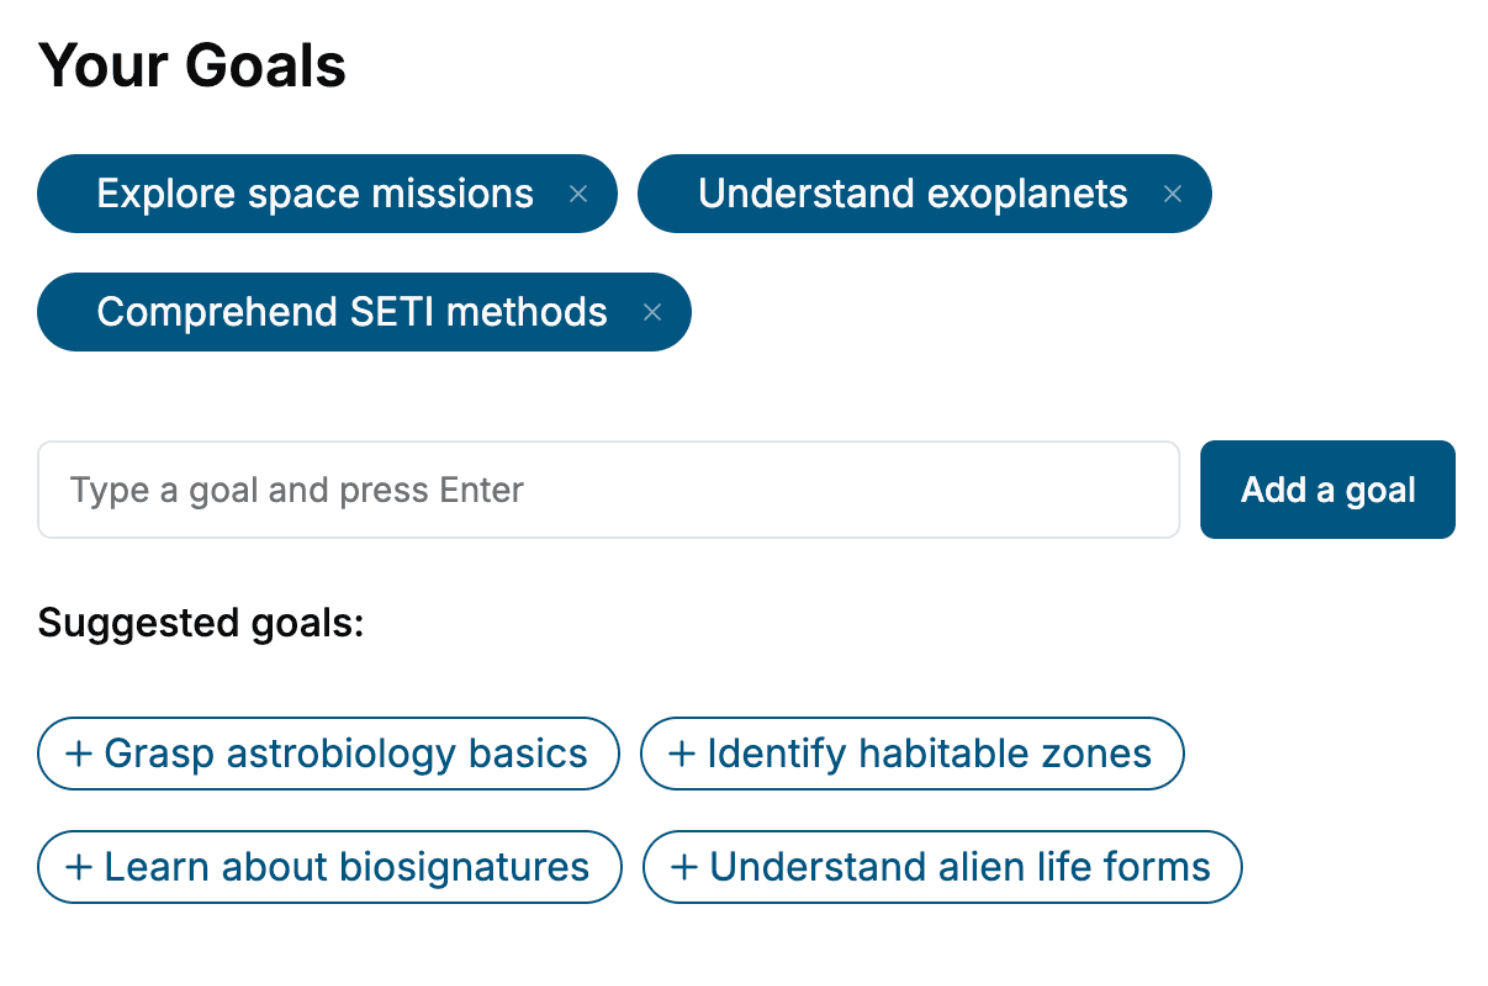
Specify your goals and choose sub-topics to include
- 3. Get your tailored book
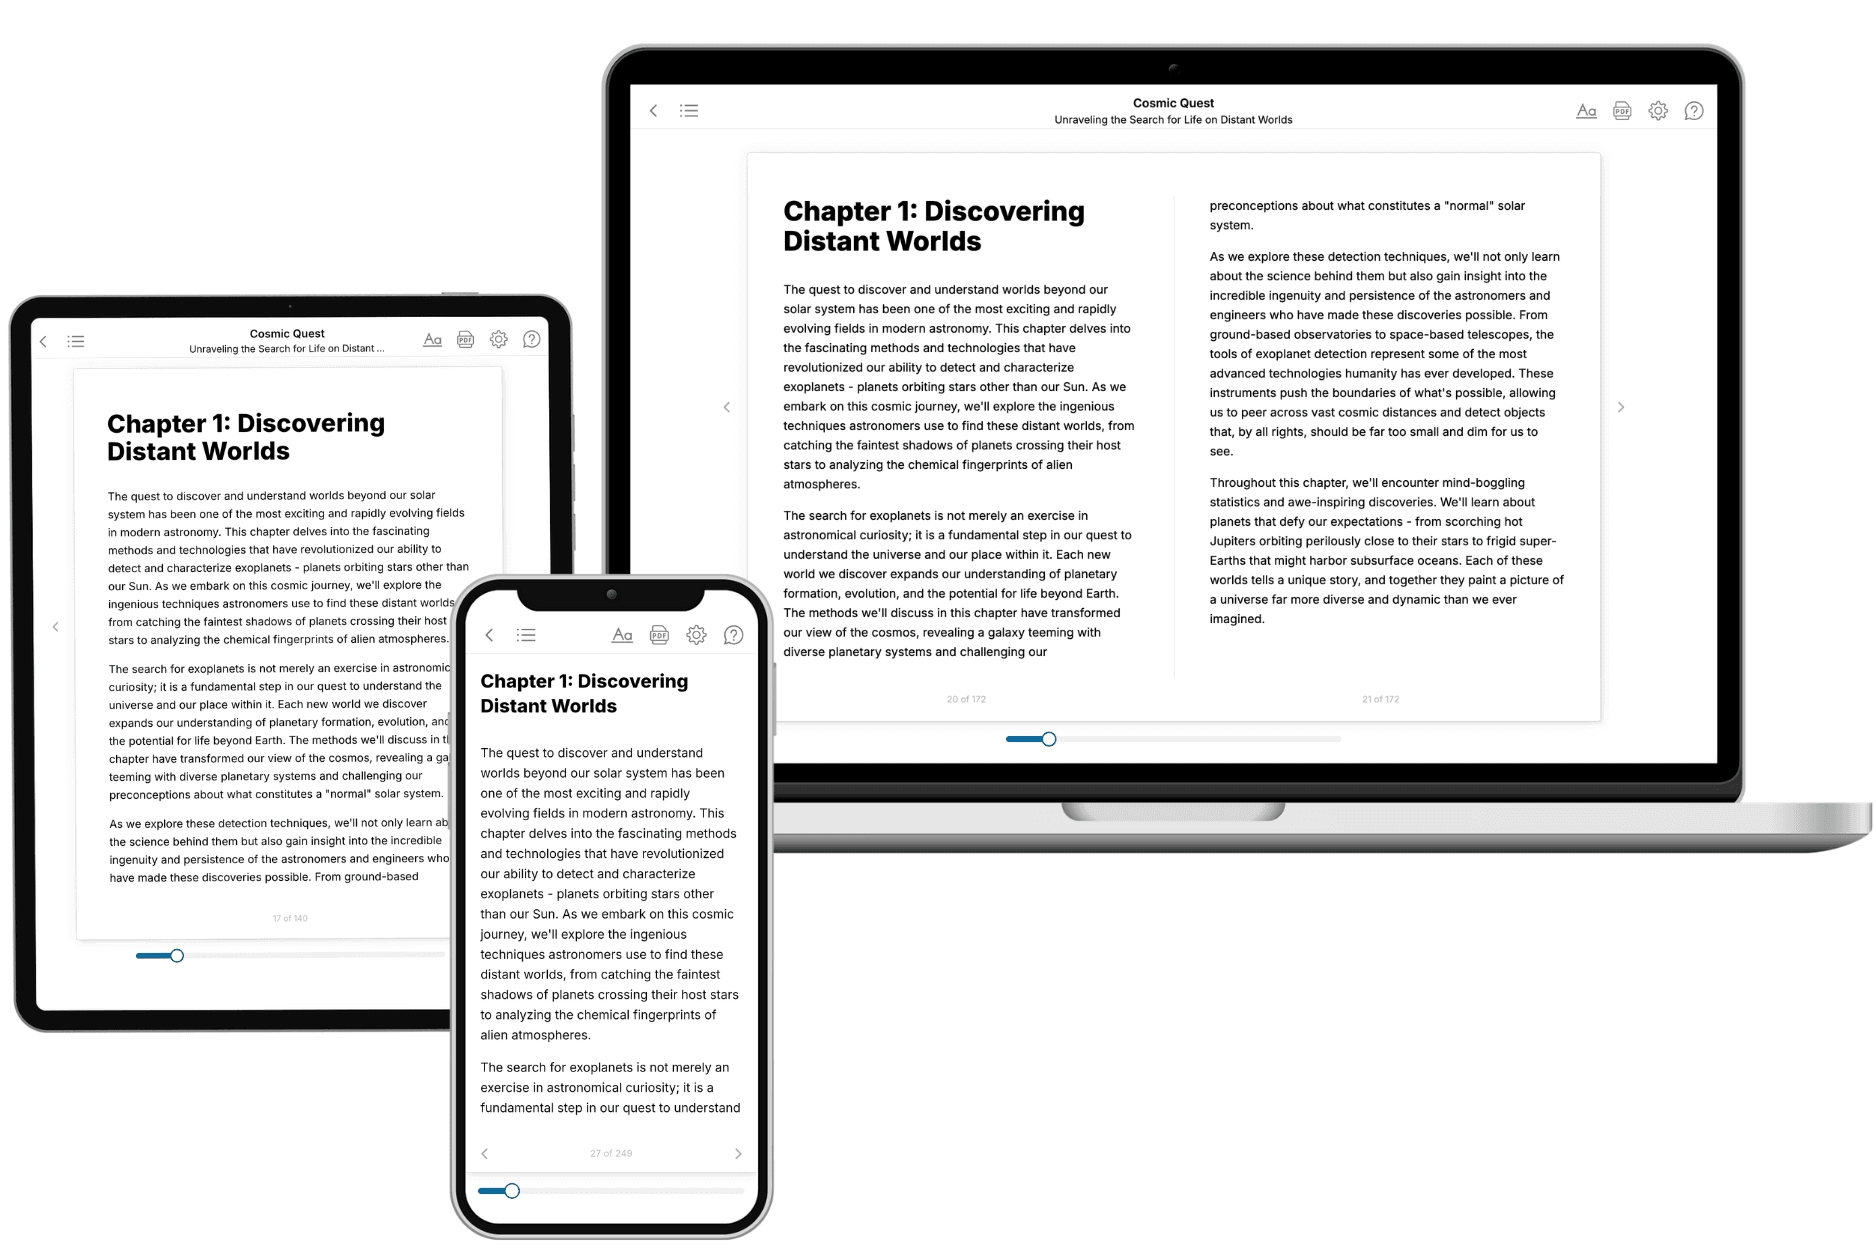
Your book is ready in 10 minutes. Read it online, download as EPUB or PDF, or send to Kindle.
Frequently asked questions
- What is TailoredRead?
TailoredRead creates complete, full-length nonfiction ebooks, written specifically for you. Tell us what you want to learn and why, and TailoredRead writes you a complete ebook on it, with charts, tables, and diagrams throughout. Read it online, on Kindle, or on any e-reader, or download it as a PDF or EPUB. Every book is written fresh the day you order it.
- How is the book tailored to me?
Before anything is written, you answer a few short questions about your goals, your background, and the topics you care about. Your book is then planned around your answers: written at your level, focused on your goals, and covering the topics you chose, instead of the one-size-fits-all book a store sells everyone.
- Will it read like generic AI content?
No. Your book isn't a chat transcript: it's planned chapter by chapter before a single word is written, told in a clear book voice, and explains ideas visually with charts, tables, and diagrams. After writing, every book goes through an editorial pass that polishes chapters so the book reads consistent from start to finish. Judge for yourself: browse thousands of sample books on our Explore Books page.
- How accurate is the content?
Our AI first checks whether your subject needs live research. Niche and fast-moving subjects are researched before writing, and the book plan and chapters are grounded in what it finds. After writing, every book goes through a quality pass that checks its facts and consistency, and researched books list their sources in a Notes section at the back.
- How long is the book?
You choose the length: Comprehensive (250-300 pages), Detailed (150-200 pages), Essential (70-100 pages), or Short (30-50 pages).
- Does the book include visuals?
Yes. Every book includes charts, tables, and diagrams: timelines, checklists, step-by-step guides, decision trees, comparison tables, matrices, and bar charts. A typical book includes dozens of these visual elements.
- Can I read it on Kindle? What formats can I download?
Yes. Every book can be read in our online reader or downloaded as a PDF or EPUB. The EPUB can be opened with Kindle, Apple Books, Kobo, and any e-reader. The Commercial and Author licenses also include an editable Word (DOCX) and Markdown download.
- How much does it cost?
About the price of a regular ebook. The exact price depends on your book's length and complexity, from $2 for the shortest books to $35 for the most comprehensive, and it's shown when you review your book, before you commit to anything. Each book is a one-time purchase, yours to keep, no subscription. Licenses that let you share, teach, or publish your book range from $35.99 to $49.99.
- Can I preview the book before purchasing?
Before you pay, you'll see what your book will cover: the title, a detailed description, the estimated length, and the complete chapter-by-chapter table of contents, so you know what you're getting before you decide. The full text itself is written after you purchase.
- How long does it take to create a book?
About 10 minutes. You can start reading the opening chapters while the rest is still being written.