Ventilator Graphics Mastery
Advanced Waveform Analysis and Clinical Decision-Making for Critical Care Professionals
Elevate your critical care practice by mastering the sophisticated language of ventilator graphics.
253 pages12 chaptersDec 29, 2025MedicineCreated by şaban
About this book
This comprehensive guide transforms your ability to interpret pressure-volume loops, flow-time waveforms, and compliance trends into actionable clinical insights that optimize patient outcomes. You'll develop systematic approaches to detecting asynchrony patterns, quantifying intrinsic PEEP, calculating work of breathing, and assessing recruitment maneuvers—all through graphics-based analysis. Learn how to integrate hemodynamic monitoring with ventilator data to make informed decisions about mode selection, PEEP titration, and sedation management. Explore advanced ventilator modes including PAV, NAVA, and APRV with detailed waveform interpretation strategies. This book provides the evidence-based frameworks, troubleshooting algorithms, and real-world case studies you need to prevent ventilator-induced lung injury, optimize weaning protocols, and teach these critical skills to your team. Whether you're refining your personal practice or building institutional expertise, this resource delivers the advanced knowledge required for excellence in mechanical ventilation management.
Table of contents
- IntroductionWhy Ventilator Graphics Matter in Modern Critical Care, Scope and Learning Objectives, How to Use This Book for Maximum Clinical ImpactRead below
- Chapter 1: Fundamentals of Ventilator Waveform PhysicsPressure Generation and Transmission in Mechanical Ventilation, Flow Dynamics and Airway Resistance Mechanics, Compliance, Elastance, and Lung Mechanics Principles, Reading and Interpreting Basic Waveform Patterns
- Chapter 2: Pressure-Volume Loop Analysis and InterpretationAnatomy of the Pressure-Volume Loop, Recognizing Normal and Abnormal PV Loop Patterns, Compliance Trending and Dynamic Lung Mechanics Assessment, Clinical Applications and Decision-Making from PV Loops
- Chapter 3: Flow-Time Waveforms and Resistance MeasurementFlow Waveform Anatomy and Interpretation, Resistance Measurement Techniques from Flow Graphics, Expiratory Flow Limitation and Air Trapping Detection, Clinical Applications of Flow-Time Analysis
- Chapter 4: Asynchrony Detection and Dyssynchrony Pattern RecognitionOverview of Patient-Ventilator Asynchrony Types, Double Triggering and Breath Stacking Recognition, Expiratory Flow Limitation and Asynchrony Patterns, Clinical Consequences and Management Strategies
- Chapter 5: PEEP Titration and Intrinsic PEEP QuantificationPEEP Physiology and Intrinsic PEEP Mechanisms, Measuring and Quantifying Intrinsic PEEP from Graphics, Evidence-Based PEEP Titration Strategies, Recruitment Maneuver Assessment and Monitoring
- Chapter 6: Driving Pressure Optimization and Lung ProtectionDriving Pressure Concept and Clinical Significance, Calculating and Monitoring Driving Pressure from Graphics, Ventilator-Induced Lung Injury Prevention Strategies, Barotrauma Risk Stratification and Mitigation
- Chapter 7: Work of Breathing and Esophageal Pressure MonitoringWork of Breathing Physiology and Clinical Relevance, Esophageal Pressure Monitoring Techniques and Interpretation, Work of Breathing Calculation from Graphics and Esophageal Data, Using Work of Breathing Data for Clinical Decision-Making
- Chapter 8: Advanced Ventilator Modes and Graphics InterpretationProportional Assist Ventilation Graphics and Synchronization, Neurally Adjusted Ventilation Waveform Analysis, Airway Pressure Release Ventilation Graphics Interpretation, Ventilator Mode Selection Logic Based on Graphics Analysis
- Chapter 9: Sedation Optimization and Weaning Readiness AssessmentGraphics-Based Sedation Titration and Depth Optimization, Weaning Readiness Indicators from Spontaneous Breathing Trial Graphics, Spontaneous Breathing Trial Graphics Interpretation, Evidence-Based Weaning Protocols and Discontinuation Strategies
- Chapter 10: Hemodynamic Monitoring Integration and Cardiovascular EffectsHemodynamic Effects of Mechanical Ventilation, Integrating Hemodynamic Data with Ventilator Graphics, PEEP Effects on Cardiac Output and Preload Assessment, Making Ventilator Adjustments Based on Hemodynamic Monitoring
- Chapter 11: Alarm Troubleshooting and Waveform-Based Problem SolvingUnderstanding Alarm Triggers and Physiologic Causes, Systematic Alarm Troubleshooting Algorithms, Advanced Waveform Troubleshooting Techniques, Reducing Alarm Fatigue Through Graphics-Based Assessment
- Chapter 12: Complex Case Studies and Clinical ApplicationCase Series: Asynchrony Detection and Management, Case Series: Weaning Challenges and Graphics-Based Solutions, Case Series: Advanced Mode Implementation and Troubleshooting
- ConclusionIntegrating Graphics Mastery into Daily Practice, Teaching Ventilator Mechanics to Residents and Trainees, Future Directions in Ventilator Graphics and Monitoring
- Appendix: Quick Reference Guides and Calculation Tools
- Glossary of Terms and Abbreviations
Introduction
Mechanical ventilation remains one of the most powerful and potentially harmful interventions in critical care medicine. Every breath delivered by a ventilator creates a complex interplay of pressures, flows, and volumes that directly impacts patient outcomes. Yet despite decades of technological advancement, many critical care physicians rely primarily on numeric displays and alarm systems, missing the rich physiologic information embedded in ventilator graphics. The waveforms scrolling across your ventilator screen represent real-time windows into lung mechanics, patient effort, and ventilator-patient interaction—data that can transform your clinical decision-making when properly interpreted.
This book addresses a fundamental gap in advanced critical care practice: the systematic interpretation of ventilator graphics to optimize patient outcomes. While basic waveform recognition forms part of standard critical care training, the sophisticated analysis required to detect subtle asynchrony patterns, quantify intrinsic PEEP, calculate work of breathing, and assess recruitment maneuvers demands specialized expertise. You already possess advanced clinical knowledge and experience managing complex ventilated patients. This resource builds on that foundation by providing the analytical frameworks, pattern recognition skills, and evidence-based protocols needed to extract maximum clinical value from ventilator graphics.
The stakes are substantial. Ventilator-induced lung injury contributes to mortality and morbidity in critically ill patients, yet many cases remain preventable through careful attention to driving pressure, compliance trends, and asynchrony patterns visible in waveform analysis[1]. Patient-ventilator asynchrony occurs in up to 80% of mechanically ventilated patients and associates with prolonged ventilation, increased sedation requirements, and worse outcomes[2]. Suboptimal PEEP titration can lead to atelectrauma or overdistension, both contributing to lung injury. These complications often manifest first in ventilator graphics, providing opportunities for early intervention before clinical deterioration occurs. Mastering graphics interpretation therefore represents not merely an academic exercise but a practical necessity for delivering optimal critical care.
Why Ventilator Graphics Matter in Modern Critical Care
Ventilator graphics provide information that numeric displays cannot capture. A pressure reading of 25 cm H₂O tells you the peak airway pressure, but the pressure-time waveform reveals whether that pressure results from high resistance, poor compliance, or patient effort. A tidal volume of 450 mL appears acceptable, but the flow-time waveform may show incomplete exhalation and breath stacking that doubles the actual delivered volume. These distinctions matter profoundly for patient safety and outcome optimization. Graphics transform ventilator monitoring from passive observation to active physiologic assessment.
Consider the detection of patient-ventilator asynchrony. Numeric displays may show acceptable oxygen saturation, tidal volumes, and respiratory rates while the patient experiences significant dyssynchrony that increases work of breathing, prolongs ventilation, and necessitates deeper sedation. The pressure-time waveform reveals ineffective triggering through small negative deflections that fail to initiate breaths. The flow-time waveform shows premature cycling when expiratory flow begins before the patient completes inspiration. The pressure-volume loop demonstrates breath stacking when sequential breaths occur without complete exhalation. Each pattern provides specific diagnostic information that guides targeted interventions—adjusting trigger sensitivity, modifying cycling criteria, or changing ventilator modes.
Graphics-based monitoring enables proactive rather than reactive ventilator management. Traditional approaches often wait for clinical deterioration—worsening oxygenation, rising peak pressures, or hemodynamic instability—before making ventilator adjustments. Waveform analysis identifies problems earlier in their evolution. Gradually decreasing compliance visible in pressure-volume loop trending may indicate developing pulmonary edema or pneumonia before radiographic changes appear. Progressive expiratory flow limitation suggests worsening air trapping that will eventually manifest as auto-PEEP and hemodynamic compromise. Recognizing these patterns early creates opportunities for intervention before complications develop.
The integration of graphics analysis with other monitoring modalities amplifies diagnostic precision. Esophageal pressure monitoring combined with airway pressure waveforms enables accurate transpulmonary pressure calculation and work of breathing quantification. Hemodynamic monitoring integrated with ventilator graphics reveals how PEEP adjustments affect cardiac output and preload. Capnography waveforms correlated with flow-time patterns identify ventilation-perfusion mismatch and dead space ventilation. This multimodal approach transforms individual data streams into comprehensive physiologic assessment that guides complex clinical decisions.
Advanced ventilator modes demand sophisticated graphics interpretation. Proportional assist ventilation, neurally adjusted ventilatory assist, and airway pressure release ventilation each create unique waveform patterns that require specialized knowledge to optimize. These modes offer potential advantages over conventional ventilation—improved synchrony, reduced sedation requirements, preserved respiratory muscle function—but only when properly implemented and monitored. Graphics provide the feedback necessary to ensure appropriate mode function, detect mode-specific complications, and make evidence-based adjustments. Without graphics mastery, advanced modes become black boxes that may harm rather than help patients.
The educational value of graphics extends beyond individual patient care. Teaching ventilator mechanics through waveform analysis builds deeper understanding than numeric displays alone. Residents and fellows who learn to interpret pressure-volume loops develop intuitive grasp of compliance and resistance concepts. Watching flow-time waveforms during spontaneous breathing trials creates visceral understanding of work of breathing and weaning readiness. Case-based teaching using actual patient graphics grounds theoretical knowledge in clinical reality. Building institutional expertise in graphics interpretation standardizes advanced practice and improves outcomes across your critical care team.
Economic and quality considerations reinforce the importance of graphics mastery. Ventilator-associated complications extend ICU length of stay, increase healthcare costs, and contribute to hospital-acquired conditions that affect reimbursement. Optimizing ventilator management through graphics analysis reduces these complications. Faster weaning decreases ventilator days and ICU utilization. Prevention of ventilator-induced lung injury reduces mortality and long-term morbidity. Improved patient-ventilator synchrony may reduce sedation requirements and associated complications. These benefits translate to better patient outcomes and more efficient resource utilization—goals that align clinical excellence with institutional priorities.
Scope and Learning Objectives
This book provides comprehensive coverage of ventilator graphics interpretation for advanced critical care practice. The content assumes you possess foundational knowledge of mechanical ventilation principles, respiratory physiology, and critical care management. Rather than reviewing basic concepts, the focus remains on sophisticated analysis techniques, pattern recognition skills, and evidence-based decision-making frameworks that optimize patient outcomes. Each chapter builds systematically on previous material, progressing from fundamental waveform physics through complex clinical applications and troubleshooting scenarios.
The primary learning objectives encompass both knowledge acquisition and skill development. You will master the physiologic principles underlying pressure, flow, and volume waveforms, understanding how lung mechanics, airway resistance, and patient effort shape graphic patterns. You will develop systematic approaches to analyzing pressure-volume loops, flow-time waveforms, and pressure-time tracings, recognizing normal variants and pathologic patterns. You will learn to detect and classify patient-ventilator asynchrony, quantify its severity, and implement targeted interventions. You will acquire techniques for measuring intrinsic PEEP, calculating driving pressure, assessing work of breathing, and evaluating recruitment maneuvers—all through graphics-based analysis.
Advanced mode interpretation forms a central component of the learning objectives. You will understand how proportional assist ventilation, neurally adjusted ventilatory assist, and airway pressure release ventilation create distinctive waveform patterns. You will learn to optimize mode settings based on graphics feedback, detect mode-specific complications, and make evidence-based decisions about mode selection. The integration of esophageal pressure monitoring with standard ventilator graphics will enable transpulmonary pressure calculation and precise work of breathing assessment. Hemodynamic monitoring integration will reveal cardiovascular effects of ventilator adjustments and guide PEEP titration decisions.
Clinical application objectives emphasize translating graphics knowledge into improved patient care. You will develop protocols for PEEP titration informed by compliance trending and recruitment assessment. You will implement lung-protective ventilation strategies guided by driving pressure optimization and pressure-volume loop analysis. You will create systematic approaches to weaning readiness assessment using spontaneous breathing trial graphics and work of breathing calculations. You will build troubleshooting algorithms that use waveform analysis to diagnose and resolve ventilator alarms, reducing false alarms while ensuring clinically meaningful alerts guide management.
The scope deliberately focuses on practical, actionable content rather than exhaustive theoretical coverage. Each chapter includes specific examples, case scenarios, and step-by-step analytical approaches you can implement immediately in clinical practice. The emphasis remains on evidence-based techniques supported by current literature rather than anecdotal experience or institutional preferences. Where controversy exists in the field—such as optimal PEEP titration strategies or best practices for asynchrony management—the text presents multiple approaches with their supporting evidence, enabling you to make informed decisions appropriate to your patient population and practice environment.
Teaching and institutional implementation objectives recognize that individual expertise must translate to team competency for maximum impact. You will learn frameworks for teaching ventilator graphics to residents, fellows, and respiratory therapists. You will develop case-based educational approaches that build pattern recognition skills. You will create standardized protocols and decision algorithms that leverage graphics analysis while remaining practical for busy clinical environments. These educational objectives ensure your graphics mastery benefits not only your personal practice but also your institution's overall critical care quality.
The book explicitly excludes certain topics to maintain focus on graphics interpretation. Detailed ventilator setup procedures, initial mode selection for specific disease states, and comprehensive reviews of respiratory pathophysiology receive limited coverage, as these topics are well-addressed in other critical care resources. Similarly, the text does not provide exhaustive technical specifications for ventilator equipment or manufacturer-specific operational details. The focus remains on universal principles of waveform interpretation applicable across ventilator platforms and clinical scenarios. This approach ensures the content remains relevant regardless of your specific equipment and maintains emphasis on physiologic understanding rather than technical operation.
How to Use This Book for Maximum Clinical Impact
This book functions as both a systematic learning resource and a practical clinical reference. Your approach to using it should align with your current expertise level and learning objectives. If you are building foundational graphics interpretation skills, sequential reading from beginning to end provides the most coherent learning experience. Each chapter builds on concepts introduced previously, creating a scaffolded approach to increasingly complex material. The early chapters on waveform physics, pressure-volume loops, and flow-time analysis establish the analytical framework necessary for later chapters on asynchrony detection, advanced modes, and complex troubleshooting.
For experienced practitioners seeking to refine specific skills, the book supports targeted reading focused on particular topics. Each chapter stands alone sufficiently to provide value without requiring complete prior chapter mastery. The detailed table of contents and subsection organization enable rapid location of relevant material. If you need to optimize PEEP titration strategies, Chapter 5 provides comprehensive coverage without requiring prior reading of earlier chapters. If you are implementing neurally adjusted ventilatory assist, Chapter 8's dedicated section offers focused guidance. This modular structure accommodates the time constraints of clinical practice while maintaining content depth.
Active engagement with the material accelerates learning and retention. Rather than passive reading, approach each chapter with specific patients in mind. When studying asynchrony detection, review your current ventilated patients' waveforms looking for the patterns described. When learning about pressure-volume loop analysis, spend time at the bedside observing how loop morphology changes with ventilator adjustments. The case studies throughout the book provide opportunities for self-assessment—cover the analysis and management sections, formulate your own interpretation and plan, then compare with the provided approach. This active learning strategy builds pattern recognition skills more effectively than reading alone.
The book includes several features designed to enhance practical application:
- Specific examples and case scenarios that illustrate concepts with realistic clinical details rather than abstract theory
- Step-by-step analytical frameworks that provide systematic approaches to waveform interpretation and clinical decision-making
- Troubleshooting algorithms that guide problem-solving when waveforms suggest complications or equipment issues
- Evidence summaries with citations that connect recommendations to supporting research, enabling deeper exploration of topics of interest
- Quick reference guides in the appendix that provide bedside-accessible summaries of key concepts and calculations
Maximize the value of these features by keeping the book accessible during clinical work. The quick reference guides serve as cognitive aids during complex decision-making, reducing reliance on memory and ensuring systematic analysis. The troubleshooting algorithms provide structured approaches to urgent situations when time pressure might otherwise lead to haphazard problem-solving. The evidence summaries enable rapid verification of recommendations and support discussions with colleagues about optimal management approaches. Consider the book a clinical tool rather than merely educational material—its value increases with repeated consultation during actual patient care.
Teaching applications deserve special attention for those in educational roles. The book's structure supports multiple teaching formats. Individual chapters or sections can form the basis for didactic lectures, with the included examples and graphics providing ready-made teaching materials. The case studies enable problem-based learning sessions where learners work through scenarios before reviewing the provided analyses. The systematic analytical frameworks can be adapted into cognitive aids and protocols for learners at various training levels. Consider developing a longitudinal curriculum that progresses through the book's chapters over an academic year, with bedside teaching sessions reinforcing concepts from each chapter.
Institutional implementation requires adapting the book's content to your specific practice environment. Begin by assessing current graphics utilization in your ICU—how consistently do clinicians review waveforms, what patterns are reliably recognized, where do knowledge gaps exist? Use this assessment to prioritize which chapters and concepts to emphasize in team education. Develop standardized protocols based on the book's frameworks, but customize them to your patient population, available equipment, and workflow patterns. Consider creating a local graphics interpretation reference guide that distills key concepts into formats accessible to all team members, from experienced physicians to newer respiratory therapists.
Ongoing skill maintenance requires deliberate practice beyond initial learning. Ventilator graphics interpretation, like any complex skill, deteriorates without regular use. Establish habits that maintain and build expertise:
- Review waveforms on every ventilated patient during rounds, not just when problems arise
- Photograph interesting or challenging waveforms for later analysis and discussion with colleagues
- Present graphics-based cases at departmental conferences to build collective expertise
- Revisit challenging book chapters periodically to reinforce concepts and discover new insights
- Seek feedback from colleagues on your waveform interpretations to identify blind spots
- Stay current with emerging literature on ventilator graphics by following key journals and authors cited throughout the book
The ultimate measure of this book's value lies in improved patient outcomes. As you develop graphics mastery, track metrics that reflect ventilator management quality in your practice: ventilator days, ventilator-associated pneumonia rates, successful extubation rates, reintubation rates, and ventilator-induced lung injury incidence. These outcomes provide objective feedback on whether enhanced graphics interpretation translates to better care. Share successes with your team to build enthusiasm for graphics-based practice. When outcomes improve, the time invested in mastering this material delivers returns far exceeding the initial learning effort—returns measured in lives saved and suffering prevented.
This is the end of the free sample. The full book has 12 chapters.
Want this book written for you?
Tell us your goals and background, and get your own version of this book, tailored by AI to you.


Benefits of AI-tailored books
- Read one book, not ten:
- all the Medicine knowledge you need, gathered into a single book.
- Save days of learning:
- tell us your goals, choose your topics, and the whole book is built around them.
- Learn effortlessly:
- Medicine book written for your specific background and expertise.
- Understand at a glance:
- includes charts, tables, timelines, checklists, decision trees, and more.
- Stay current:
- written the day you order it, not years ago.
- Trust what you read:
- every book is checked for accuracy, with real research when your subject needs it.
Create your unique book in 3 steps
- 1. Select your focus
Select the focus of your Medicine book and share your background
- 2. Personalize your book
Specify your goals and choose sub-topics to include
- 3. Get your tailored book
Your book is ready in 10 minutes. Read it online, download as EPUB or PDF, or send to Kindle.

Frequently asked questions
- What is TailoredRead?
TailoredRead creates complete, full-length nonfiction ebooks, written specifically for you. Tell us what you want to learn and why, and TailoredRead writes you a complete ebook on it, with charts, tables, and diagrams throughout. Read it online, on Kindle, or on any e-reader, or download it as a PDF or EPUB. Every book is written fresh the day you order it.
- How is the book tailored to me?
Before anything is written, you answer a few short questions about your goals, your background, and the topics you care about. Your book is then planned around your answers: written at your level, focused on your goals, and covering the topics you chose, instead of the one-size-fits-all book a store sells everyone.
- Will it read like generic AI content?
No. Your book isn't a chat transcript: it's planned chapter by chapter before a single word is written, told in a clear book voice, and explains ideas visually with charts, tables, and diagrams. After writing, every book goes through an editorial pass that polishes chapters so the book reads consistent from start to finish. Judge for yourself: browse thousands of sample books on our Explore Books page.
- How accurate is the content?
Our AI first checks whether your subject needs live research. Niche and fast-moving subjects are researched before writing, and the book plan and chapters are grounded in what it finds. After writing, every book goes through a quality pass that checks its facts and consistency, and researched books list their sources in a Notes section at the back.
- How long is the book?
You choose the length: Comprehensive (250-300 pages), Detailed (150-200 pages), Essential (70-100 pages), or Short (30-50 pages).
- Does the book include visuals?
Yes. Every book includes charts, tables, and diagrams: timelines, checklists, step-by-step guides, decision trees, comparison tables, matrices, and bar charts. A typical book includes dozens of these visual elements.
- Can I read it on Kindle? What formats can I download?
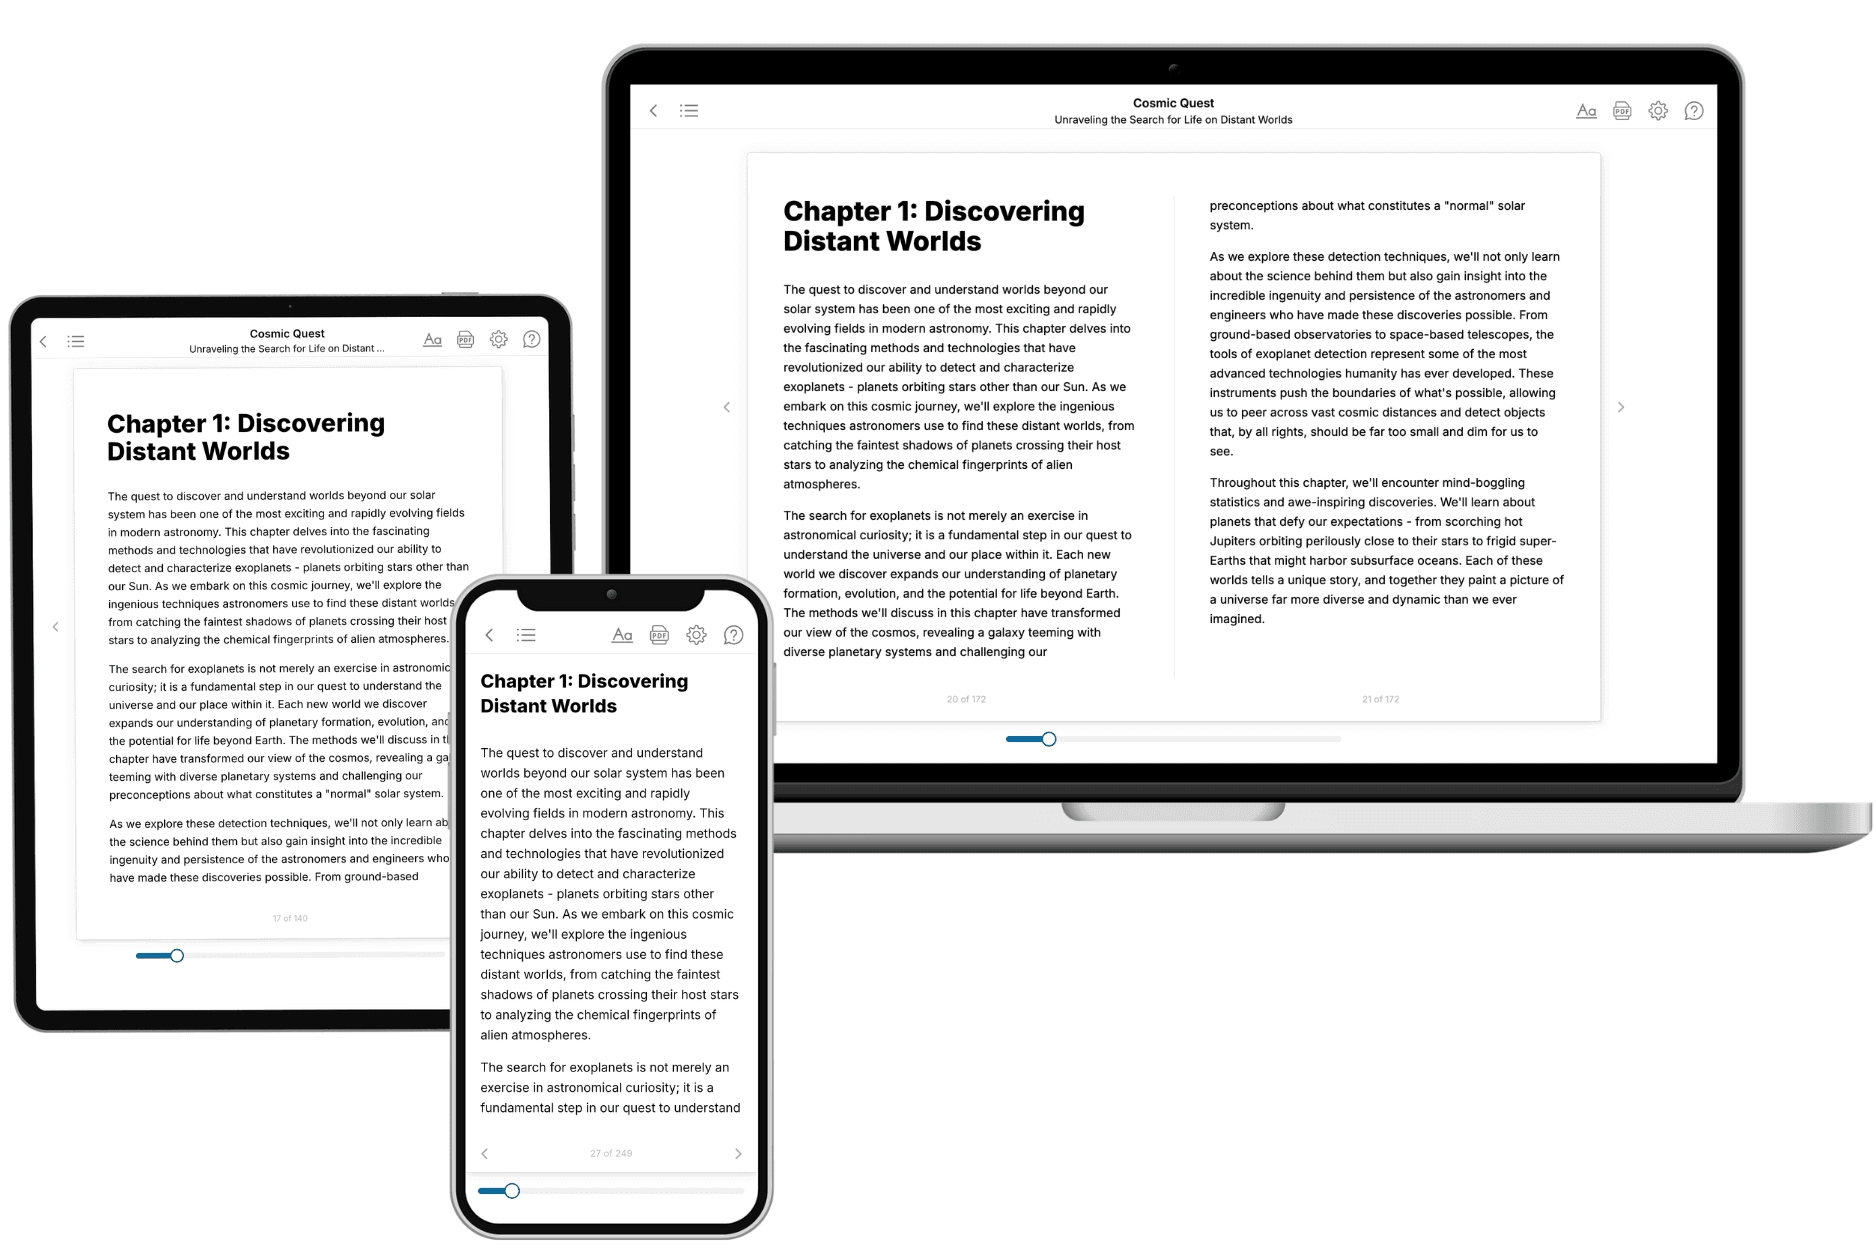
Yes. Every book can be read in our online reader or downloaded as a PDF or EPUB. The EPUB can be opened with Kindle, Apple Books, Kobo, and any e-reader. The Commercial and Author licenses also include an editable Word (DOCX) and Markdown download.
- How much does it cost?
About the price of a regular ebook. The exact price depends on your book's length and complexity, from $2 for the shortest books to $35 for the most comprehensive, and it's shown when you review your book, before you commit to anything. Each book is a one-time purchase, yours to keep, no subscription. Licenses that let you share, teach, or publish your book range from $35.99 to $49.99.
- Can I preview the book before purchasing?
Before you pay, you'll see what your book will cover: the title, a detailed description, the estimated length, and the complete chapter-by-chapter table of contents, so you know what you're getting before you decide. The full text itself is written after you purchase.
- How long does it take to create a book?
About 10 minutes. You can start reading the opening chapters while the rest is still being written.