YouTube Analytics Mastery
The Complete Guide to Understanding Metrics, Optimizing Performance, and Growing Your Channel
Imagine having complete clarity on why some of your videos succeed while others underperform.
238 pages11 chaptersAug 10, 2026YouTube Marketing
About this book
Picture yourself confidently making content decisions backed by real data instead of guessing what your audience wants. This book gives you that clarity. YouTube Analytics Mastery walks you through every metric that matters, from watch time and audience retention to Click-Through Rate and RPM. You'll learn how YouTube's algorithm actually works, what the platform prioritizes, and exactly how to optimize each element of your content strategy. Whether you're struggling to understand your analytics dashboard, trying to improve viewer retention, or aiming to increase revenue, this guide provides actionable strategies grounded in how YouTube's system actually functions. You'll discover how to use YouTube Studio's tools effectively, interpret retention curves to identify content weaknesses, and leverage AI-driven insights to make faster decisions. By the end, you'll have a complete framework for analyzing performance, testing improvements, and scaling what works—turning data from confusing numbers into your competitive advantage.
Table of contents
- IntroductionWhy Analytics Matter More Than Ever, What You'll Learn in This Book, How to Use This GuideRead below
- Chapter 1: Understanding YouTube Analytics FundamentalsThe YouTube Studio Dashboard: Your Command Center, The Five Core Metrics You Need to Know, Impressions: How YouTube Shows Your Content, Sessions: Understanding Viewer Engagement Periods
- Chapter 2: Watch Time and Average View Duration: The Algorithm's FavoritesWhy Watch Time Drives YouTube's Algorithm, Average View Duration: The Per-Video Engagement Indicator, Watch Time vs. Average View Duration: Which Matters More?, Strategies to Increase Watch Time on Your Channel
- Chapter 3: Audience Retention: The Retention Curve ExplainedReading Your Audience Retention Curve, The Critical First 60 Seconds: Why 55% Drop Off, Using Retention Data to Identify Content Weaknesses, Benchmarking Your Retention Against Industry Standards
- Chapter 4: Click-Through Rate and Impressions: Controlling Your VisibilityUnderstanding Click-Through Rate (CTR), Impression Click-Through Rate (ICTR): The Algorithm's Gatekeeper, Thumbnail Optimization: Your First Impression Matters, Title Strategy: Balancing Clicks and Authenticity
- Chapter 5: Shorts and Engaged Views: The New Metrics LandscapeYouTube Shorts: A Different Analytics Game, Engaged Views: Why This Metric Matters More Than Total Views, Comparing Shorts Performance to Long-Form Content, Optimizing Your Shorts Strategy Using Engaged Views Data
- Chapter 6: Revenue Metrics: Understanding CPM and RPMCPM: What Advertisers Pay Per 1,000 Impressions, RPM: Your Actual Earnings Per 1,000 Views, The Gap Between CPM and RPM: Where Your Money Goes, Strategies to Increase Your RPM and Channel Revenue
- Chapter 7: YouTube Studio Tools: Navigating Your Analytics DashboardThe Updated YouTube Studio Interface (2026 Refresh), The Analytics Tab: Finding What You Need, The Research Tab: Discovering What Your Audience Searches For, Filtering and Customizing Your Analytics View
- Chapter 8: Ask Studio: Using AI to Understand Your PerformanceWhat Is Ask Studio and How It Works, Asking Questions in Plain English: Query Examples, Interpreting AI-Generated Performance Summaries, Understanding Ask Studio's Capabilities and Limitations
- Chapter 9: Audience Insights: Understanding Who Watches Your ContentDemographic Data: Age, Gender, and Location, Behavioral Insights: How Your Audience Finds and Watches Content, Subscriber vs. Non-Subscriber Viewing Patterns, Retention Patterns Across Different Audience Segments
- Chapter 10: Building Your Data-Driven Content StrategyIdentifying Your Best-Performing Content, Finding Content Gaps Using Research and Analytics Data, Creating a Testing Framework for Content Optimization, Using Data to Iterate and Improve Over Time
- Chapter 11: Advanced Analytics: Going Deeper with YouTube Analytics APIIntroduction to YouTube Analytics API, Real-World Use Cases for Programmatic Data Access, Building Custom Dashboards and Reports
- Conclusion: From Data to ActionYour Analytics Mastery Checklist, Your Next Steps Forward
- Glossary of YouTube Analytics Terms
- Further Reading and Resources
Introduction
Most creators open their YouTube Studio dashboard, stare at the numbers for a few minutes, and then close the tab without changing anything. Not because the data isn't useful, but because nobody taught them how to read it. Watch Time, Click-Through Rate, Impressions, RPM — these terms appear everywhere, yet their relationship to each other and to actual channel growth stays frustratingly unclear. That gap between having data and knowing what to do with it is exactly what this book closes.
YouTube Analytics is not a passive reporting tool. It is a feedback system that tells you, with remarkable precision, what your audience responds to and what they ignore. Every video you publish generates a stream of behavioral signals: how long people watch, where they stop, whether they clicked your thumbnail, and whether they came back for more. The platform uses those same signals to decide which videos to recommend next. Understanding that loop is the foundation of every growth strategy that actually works.
The analytics environment has also grown considerably more capable in recent years. The YouTube Studio interface received a significant redesign, the Ask Studio AI assistant began rolling out to give creators natural-language access to their performance data, and Engaged Views emerged as the primary signal for YouTube Shorts performance. These are not cosmetic updates. They change how you should read your data and where you should focus your attention. This book reflects that current state of the platform, not a version from two or three years ago.
What follows is a practical, metric-by-metric guide to understanding your channel's performance and using that understanding to make better content decisions. The goal is not to turn you into a data scientist. The goal is to make analytics feel as natural and useful as checking your phone — something you do regularly, quickly, and with a clear sense of what you're looking for.
Why Analytics Matter More Than Ever
YouTube is one of the most competitive content environments on the internet. Millions of videos are uploaded every day, and the platform's recommendation algorithm decides which ones get seen. That algorithm does not reward effort, production quality, or good intentions. It rewards engagement. Specifically, it rewards content that keeps people watching, clicking, and returning. Analytics is how you find out whether your content is doing those things — and by how much.
The creators who grow consistently are not necessarily the most talented or the most prolific. They are the ones who pay attention to feedback and adjust. A channel that publishes twelve videos a year and studies the data carefully will often outperform a channel that publishes weekly but never looks at retention curves or Click-Through Rate. Volume without feedback is just repetition. Analytics turns repetition into iteration, which is a fundamentally different and more productive process.
Consider a concrete example. Two creators both publish a ten-minute tutorial video on the same topic. Creator A gets 8,000 views and a 35% average retention rate. Creator B gets 12,000 views but only 18% average retention. On the surface, Creator B looks more successful. But YouTube's algorithm sees Creator B's audience abandoning the video early and interprets that as a signal that the content is not satisfying. Over time, the algorithm reduces recommendations for Creator B's videos. Creator A, with stronger retention, gets more recommendations and compounds that advantage over months. Without analytics, Creator B never understands why their growth stalls.
Analytics also matter because YouTube's own priorities have shifted. The platform increasingly values content that generates genuine engagement rather than passive views. The expansion of Engaged Views as a core metric for YouTube Shorts reflects this shift directly. A view where someone actively chose to watch rather than scroll past is worth more to the algorithm than a view that happened by accident. Knowing which of your videos generate that kind of intentional engagement changes how you plan your content calendar.
There is also a revenue dimension that analytics makes visible. The gap between what advertisers pay (CPM) and what creators actually receive (RPM) is not fixed. It varies by audience demographics, content category, time of year, and viewer geography. Creators who understand this gap can make strategic decisions about content topics, upload timing, and audience development that meaningfully increase their earnings without needing more views. That kind of leverage is only available to creators who read their data.
Finally, analytics matter because the tools have never been more accessible. YouTube Studio is free, built directly into the platform, and now includes AI-assisted analysis through Ask Studio. You do not need a third-party subscription or a background in data analysis to get actionable insights from your channel. The barrier is not access — it is knowing what to look for and what questions to ask. That is precisely what this book teaches.
The creators who grow consistently are not the ones who guess what their audience wants. They are the ones who let the data tell them — and then act on what they hear.
Understanding analytics is also a form of competitive intelligence. When you know which of your videos perform above average on retention, you can study what those videos have in common and replicate those patterns. When you know which traffic sources drive your most engaged viewers, you can prioritize those channels. Your competitors who are not reading their data are essentially flying blind. Every time you make a data-informed decision, you widen the gap between your channel and theirs.
What You'll Learn in This Book
This book is organized around the metrics and tools that matter most to channel growth, moving from foundational concepts to advanced applications. Each chapter focuses on a specific area of analytics, explains what the numbers mean, and gives you concrete actions to take based on what you find. The structure is deliberate: later chapters build on earlier ones, so the concepts compound as you read.
The first chapter establishes the foundation. It introduces YouTube Studio as a measurement system and defines the Five Core Metrics and Sessions as the vocabulary everything else depends on. If you have ever felt confused by the dashboard or unsure which numbers to prioritize, that chapter reorients your perspective and gives you a clear starting point.
From there, the book moves into the two metrics that drive YouTube's algorithm most directly: Watch Time and Average View Duration. These are not the same thing, and the distinction matters. The chapter on these metrics explains how each is calculated, why the algorithm weights them, and what specific actions increase both. It also addresses a common misconception — that longer videos are always better for Watch Time — and replaces it with a more nuanced and accurate framework.
Audience Retention gets its own dedicated chapter because the Retention Curve is one of the most diagnostic tools available to any creator. A retention graph does not just tell you how long people watched. It tells you exactly where they stopped, where they rewatched, and what that pattern reveals about your content's structure. The chapter on Audience Retention covers how to read those curves, what the 60-second drop-off benchmark means for your hook strategy, and how to use retention data to identify and fix specific weaknesses in your videos.
Click-Through Rate and Impressions form the visibility layer of the algorithm. These metrics determine whether YouTube shows your content to potential viewers in the first place. The chapter on these topics covers Thumbnail and title optimization with a practical, testable approach — not vague advice about "being eye-catching," but specific principles for what makes a Thumbnail work and how to evaluate whether yours is performing.
YouTube Shorts operates under a different set of rules than long-form content, and the chapter on Shorts and Engaged Views explains why. The shift toward Engaged Views as the primary performance signal for short-form content changes what success looks like on that format. That chapter gives you a clear framework for measuring Shorts performance accurately and using that data to refine your short-form strategy.
Revenue metrics — CPM and RPM — are covered in depth because they are widely misunderstood. Many creators focus on view counts as a proxy for earnings, which leads to poor strategic decisions. The chapter on revenue metrics explains the gap between what advertisers pay and what creators receive, identifies the levers that actually move RPM, and gives you a realistic model for thinking about channel monetization.
The book then moves into the tools themselves. The chapter on YouTube Studio covers the updated interface, the YouTube Studio Analytics Tab, and the Research Tab — including how to use audience search data for content ideation. The chapter on Ask Studio explains how to query the AI assistant effectively, what kinds of questions it answers well, and where its limitations lie. These two chapters are practical and interface-focused, designed to help you navigate the platform confidently.
Audience Insights gets its own chapter because knowing who watches your content is as important as knowing how they watch it. Audience Demographics, geographic data, and Subscriber vs. Non-Subscriber Viewing patterns all inform content decisions in ways that raw performance metrics cannot. That chapter shows you how to read those signals and use them to tailor your content to the audience you actually have — not the one you assumed you had.
The final two chapters synthesize everything into action. The chapter on Data-Driven Content Strategy shows you how to identify your best-performing content, find gaps in your topic coverage using the Research Tab, and build a Content Testing Framework that generates reliable insights over time. The chapter on the YouTube Analytics API introduces programmatic data access for creators who want to build custom dashboards or automate their reporting — a genuinely useful capability for channels at scale.
By the end of this book, you will have a complete, working framework for analyzing your channel's performance, diagnosing problems, testing solutions, and scaling what works. The metrics will no longer feel like abstract numbers. They will feel like a conversation your audience is having with you — one that tells you exactly what to do next.
How to Use This Guide
This book is designed to be read in order, at least the first time through. The chapters build on each other in a specific sequence: foundational vocabulary first, then individual metrics in depth, then tools and interfaces, then strategy and advanced applications. Jumping ahead to the strategy chapter without understanding Watch Time and Audience Retention will make the advice harder to apply. The sequence is intentional, and following it will give you the clearest path from confusion to competence.
That said, once you have read the book once, it works well as a reference. Each chapter is self-contained enough that you can return to the Audience Retention chapter when you are diagnosing a specific video, or revisit the CPM and RPM chapter when you are thinking about monetization strategy. The glossary at the back of the book gives you quick definitions for every canonical term used throughout, so you can look up any metric without hunting through chapters.
The most effective way to use this guide is alongside your actual YouTube Studio dashboard. Do not just read about the Retention Curve — open your analytics and look at your own retention curves while you read. Do not just absorb the theory of Click-Through Rate — pull up your Impressions data and compare it to your Click-Through Rate for your last ten videos. The concepts will stick faster and feel more relevant when you are applying them to real data from your own channel in real time.
Each chapter includes concrete examples and specific actions. Treat those as starting points, not scripts. Your channel's niche, audience, and content style will shape how you apply the principles. A gaming channel and a personal finance channel will have very different retention benchmarks, very different Thumbnail strategies, and very different CPM ranges. The frameworks in this book are designed to be adapted, not copied verbatim. Use the examples to understand the logic, then apply that logic to your own situation.
Here is a practical approach to getting the most from each chapter:
- Read the chapter fully before opening your analytics.
- Identify the one or two metrics the chapter focuses on and locate them in your YouTube Studio dashboard.
- Compare your numbers to the benchmarks and examples discussed in the chapter.
- Write down one specific action you will take based on what you find — not a vague goal, but a concrete next step.
- Implement that action on your next video and note the result.
This five-step loop — read, locate, compare, decide, act — is the core habit that separates creators who grow from creators who stagnate. Analytics without action is just observation. The goal of this book is to make action the natural outcome of every time you open your dashboard.
A note on the tools covered here: YouTube Studio is a live product that receives regular updates. The interface described in the chapter on navigating YouTube Studio reflects the most current version available at the time of writing, including the redesigned layout and the Ask Studio AI assistant. If you notice minor differences between what is described and what you see on your screen, the underlying concepts and metrics remain the same. Focus on the principles, and the interface details will fall into place.
If you are newer to YouTube analytics, the chapters on the Five Core Metrics and Sessions, Watch Time, and Audience Retention will likely feel most immediately useful. Those three areas account for the majority of the algorithm's decision-making and the majority of the growth opportunities available to most channels. If you are more experienced and already comfortable with those fundamentals, the chapters on Ask Studio, Audience Demographics, and the YouTube Analytics API will push your practice further.
One final point: analytics is not a substitute for good content. No amount of data analysis will make a poorly conceived video perform well. What analytics does is help you understand what "good" means for your specific audience, so you can make more of it more consistently. The data does not create the content — you do. But the data tells you whether the content is landing, and that feedback is what makes improvement possible. Think of this book as the guide to having that conversation with your audience more clearly and more often.
This is the end of the free sample. The full book has 11 chapters.
Want this book written for you?
Tell us your goals and background, and get your own version of this book, tailored by AI to you.


Benefits of AI-tailored books
- Read one book, not ten:
- all the YouTube Marketing knowledge you need, gathered into a single book.
- Save days of learning:
- tell us your goals, choose your topics, and the whole book is built around them.
- Learn effortlessly:
- YouTube Marketing book written for your specific background and expertise.
- Understand at a glance:
- includes charts, tables, timelines, checklists, decision trees, and more.
- Stay current:
- written the day you order it, not years ago.
- Trust what you read:
- every book is checked for accuracy, with real research when your subject needs it.
Create your unique book in 3 steps
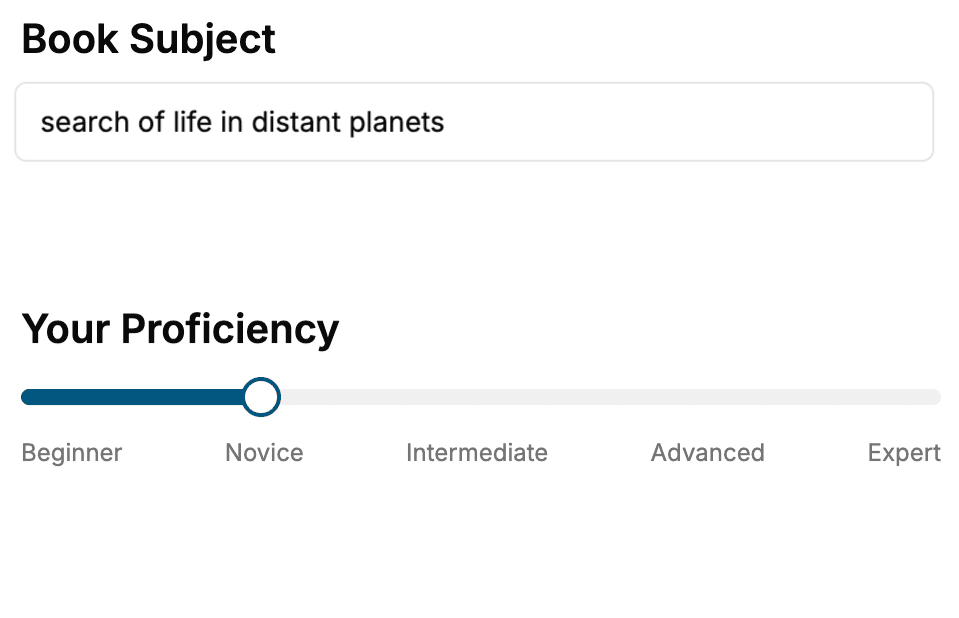
- 1. Select your focus
Select the focus of your YouTube Marketing book and share your background
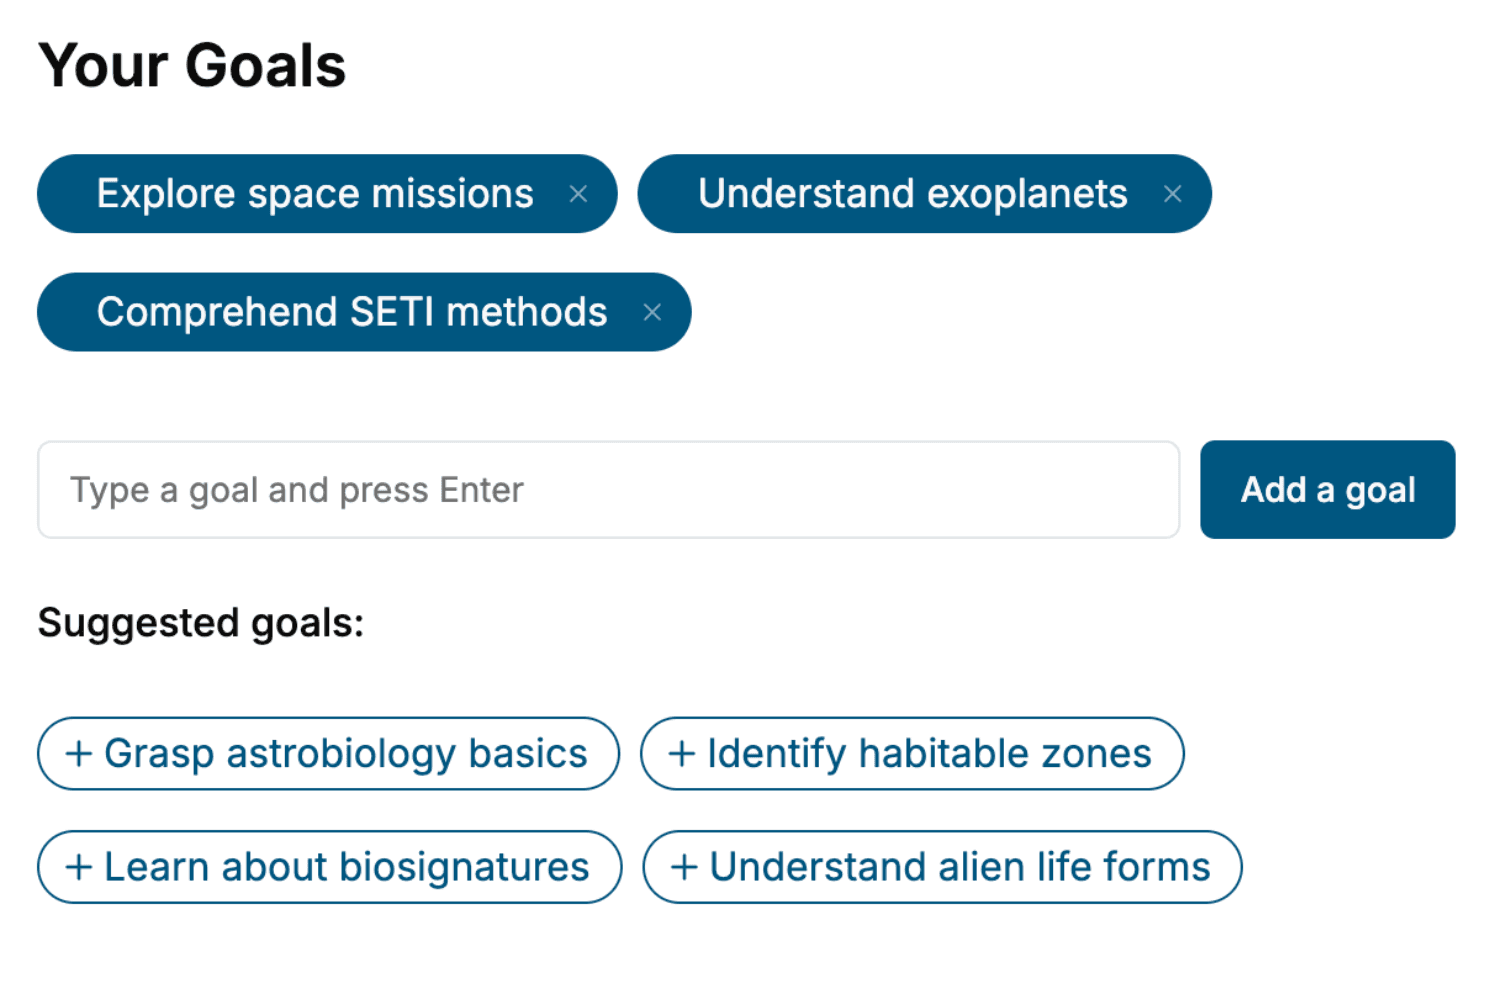
- 2. Personalize your book
Specify your goals and choose sub-topics to include
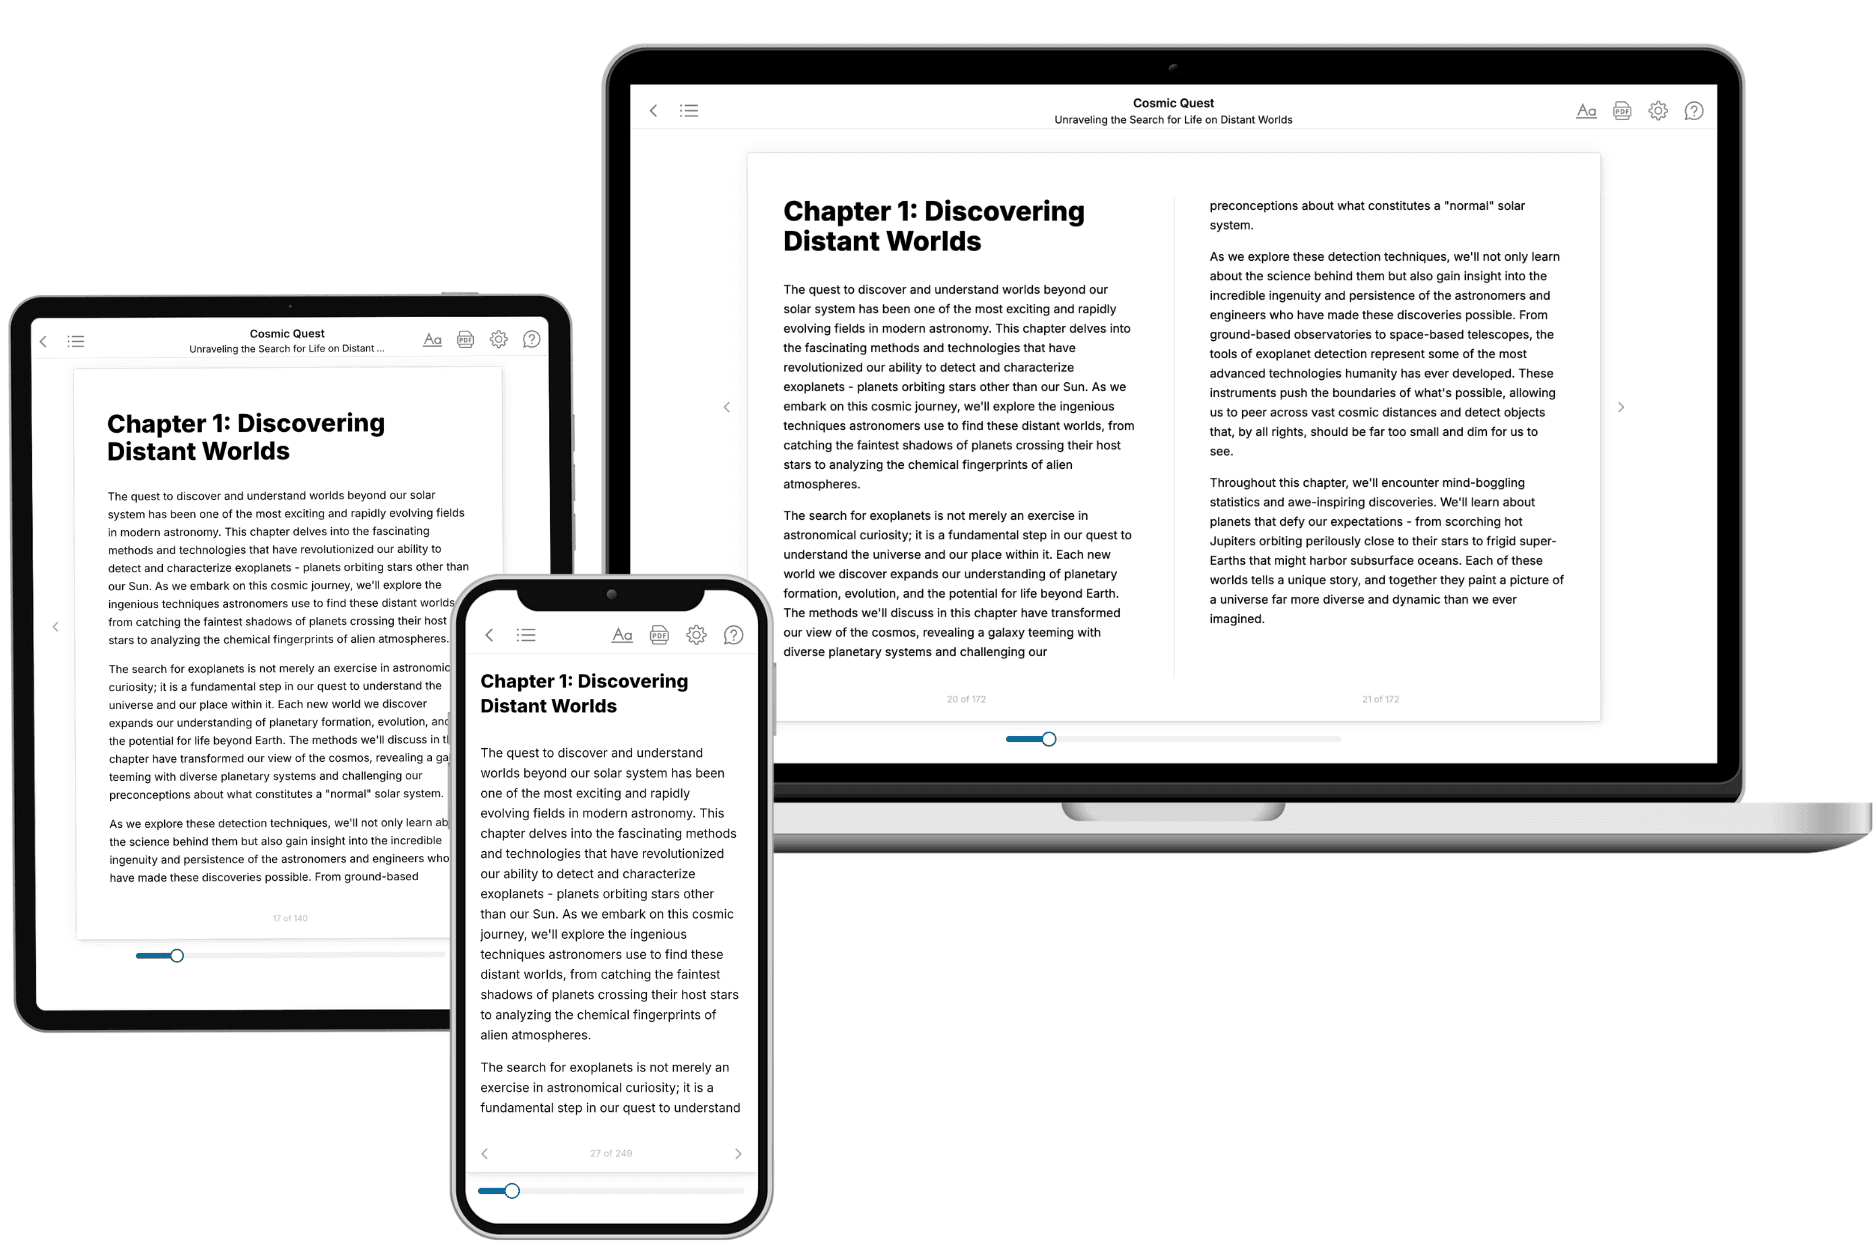
- 3. Get your tailored book
Your book is ready in 10 minutes. Read it online, download as EPUB or PDF, or send to Kindle.
Frequently asked questions
- What is TailoredRead?
TailoredRead creates complete, full-length nonfiction ebooks, written specifically for you. Tell us what you want to learn and why, and TailoredRead writes you a complete ebook on it, with charts, tables, and diagrams throughout. Read it online, on Kindle, or on any e-reader, or download it as a PDF or EPUB. Every book is written fresh the day you order it.
- How is the book tailored to me?
Before anything is written, you answer a few short questions about your goals, your background, and the topics you care about. Your book is then planned around your answers: written at your level, focused on your goals, and covering the topics you chose, instead of the one-size-fits-all book a store sells everyone.
- Will it read like generic AI content?
No. Your book isn't a chat transcript: it's planned chapter by chapter before a single word is written, told in a clear book voice, and explains ideas visually with charts, tables, and diagrams. After writing, every book goes through an editorial pass that polishes chapters so the book reads consistent from start to finish. Judge for yourself: browse thousands of sample books on our Explore Books page.
- How accurate is the content?
Our AI first checks whether your subject needs live research. Niche and fast-moving subjects are researched before writing, and the book plan and chapters are grounded in what it finds. After writing, every book goes through a quality pass that checks its facts and consistency, and researched books list their sources in a Notes section at the back.
- How long is the book?
You choose the length: Comprehensive (250-300 pages), Detailed (150-200 pages), Essential (70-100 pages), or Short (30-50 pages).
- Does the book include visuals?
Yes. Every book includes charts, tables, and diagrams: timelines, checklists, step-by-step guides, decision trees, comparison tables, matrices, and bar charts. A typical book includes dozens of these visual elements.
- Can I read it on Kindle? What formats can I download?
Yes. Every book can be read in our online reader or downloaded as a PDF or EPUB. The EPUB can be opened with Kindle, Apple Books, Kobo, and any e-reader. The Commercial and Author licenses also include an editable Word (DOCX) and Markdown download.
- How much does it cost?
About the price of a regular ebook. The exact price depends on your book's length and complexity, from $2 for the shortest books to $35 for the most comprehensive, and it's shown when you review your book, before you commit to anything. Each book is a one-time purchase, yours to keep, no subscription. Licenses that let you share, teach, or publish your book range from $35.99 to $49.99.
- Can I preview the book before purchasing?
Before you pay, you'll see what your book will cover: the title, a detailed description, the estimated length, and the complete chapter-by-chapter table of contents, so you know what you're getting before you decide. The full text itself is written after you purchase.
- How long does it take to create a book?
About 10 minutes. You can start reading the opening chapters while the rest is still being written.