Causal Loop Diagramming
Master the Art of Mapping Complex Systems and Feedback Dynamics
Most people struggle to understand why complex systems behave the way they do.
207 pages9 chaptersDec 1, 2025Systems Analysis
About this book
They see problems but can't trace them to their root causes, or they implement solutions that backfire unexpectedly. The missing piece is a systematic way to visualize how different elements of a system interact and influence each other over time. Causal loop diagramming provides exactly that—a practical methodology for mapping the feedback loops, delays, and relationships that drive system behavior. This book teaches you how to construct clear, accurate causal loop diagrams that reveal the hidden dynamics within organizations, markets, ecosystems, and social systems. You'll learn to distinguish between reinforcing loops that amplify change and balancing loops that resist it, identify leverage points where small interventions create outsized effects, and communicate complex system dynamics to stakeholders and decision-makers. Whether you're conducting research, solving organizational problems, or analyzing policy impacts, this guide equips you with the tools to think systemically and diagram with confidence.
Table of contents
- IntroductionWhy Systems Thinking Matters, What Are Causal Loop Diagrams?, How to Use This Book, What You'll Learn and AccomplishRead below
- Chapter 1: Foundations of Systems ThinkingLinear Thinking vs. Systems Thinking, Understanding Feedback Loops, Stocks, Flows, and System Behavior
- Chapter 2: Core Concepts and NotationVariables and Causal Relationships, Polarity: Positive and Negative Links, Standard Notation and Conventions, Representing Delays and Time Lags
- Chapter 3: Reinforcing and Balancing LoopsReinforcing Loops: Amplification and Growth, Balancing Loops: Resistance and Stability, Identifying Loops in Complex Systems, Understanding Loop Dominance and Behavior
- Chapter 4: Building Your First Causal Loop DiagramDefining Your System and Problem, Selecting Key Variables, Mapping Relationships and Causality, Constructing Your First Diagram
- Chapter 5: Advanced Diagramming TechniquesHandling Complex Multi-Loop Systems, Aggregation and Decomposition Strategies, Making Boundary and Scope Decisions, Iterative Refinement and Validation
- Chapter 6: Common Pitfalls and How to Avoid ThemOversimplification and Missing Feedback, Vague Variables and Ambiguous Relationships, Ignoring Delays and Time Dynamics, Validation Errors and Testing Assumptions
- Chapter 7: From Diagrams to Insights and ActionIdentifying Leverage Points for Intervention, Using Diagrams for Scenario Analysis, Communicating System Dynamics to Stakeholders, Supporting Better Decisions with Diagrams
- Chapter 8: Real-World Applications Across DisciplinesOrganizational Management and Change, Public Health and Disease Dynamics, Environmental and Sustainability Systems, Economic Policy and Market Dynamics
- Chapter 9: Integration with Other Research MethodsIntegrating with Qualitative Research, Bridging to System Dynamics Simulation, Mixed-Methods Approaches
- ConclusionYour Journey to Systems Mastery, Next Steps and Continued Learning
- Glossary
- Further Reading and Resources
Introduction
Complex systems surround us. Organizations struggle with unintended consequences when implementing new policies. Public health officials watch interventions succeed in one community but fail in another. Environmental managers see ecosystems respond unpredictably to conservation efforts. Economic analysts puzzle over market behaviors that defy simple cause-and-effect explanations. The common thread connecting these challenges is that traditional linear thinking—the assumption that A causes B in a straightforward chain—fails to capture the reality of how systems actually work. Real-world systems involve feedback, delays, interconnections, and circular causality that create behaviors far more complex than the sum of their parts.
Most professionals receive training that emphasizes breaking problems into smaller pieces, analyzing each component separately, and then reassembling the parts into solutions. This reductionist approach works well for mechanical problems with clear boundaries and predictable relationships. But when you face situations where actions create ripple effects, where solutions to one problem create new problems elsewhere, or where small changes sometimes produce dramatic results while large efforts yield disappointing outcomes, you need a different way of thinking. You need tools that help you see the whole system, understand how its parts interact over time, and identify where interventions will be most effective. This is where causal loop diagramming becomes invaluable.
Causal loop diagrams provide a visual language for mapping the feedback structures that drive system behavior. They reveal the hidden connections between variables, show how effects circle back to influence their own causes, and make explicit the assumptions we hold about how systems work. Unlike dense mathematical models that require specialized software and training, causal loop diagrams use simple notation that anyone can learn. Unlike purely verbal descriptions that become unwieldy as complexity increases, these diagrams organize information spatially in ways that make patterns visible at a glance. They serve as thinking tools that help you work through complexity, communication tools that help you share insights with others, and analytical tools that help you predict how systems will respond to change.
This book is designed for professionals and researchers who already understand that systems thinking matters but want practical skills to apply it effectively. You might be a manager trying to understand why organizational initiatives keep producing unexpected results. You could be a researcher studying social, ecological, or economic phenomena where multiple factors influence each other simultaneously. Perhaps you're a policy analyst tasked with evaluating interventions in complex domains where simple pilot studies don't predict full-scale outcomes. Or you might be a consultant who needs to help clients see their challenges from a systems perspective. Whatever your specific context, you recognize that the problems you face involve feedback, time delays, and interconnections that demand more sophisticated analytical approaches.
Why Systems Thinking Matters
The limitations of linear thinking become apparent whenever you encounter situations where interventions backfire or where problems persist despite repeated attempts to solve them. Consider a common organizational scenario: a company experiences quality problems, so management increases inspection and quality control measures. Initially, defect rates drop as inspectors catch more problems. But over time, production workers become less careful because they know inspectors will catch mistakes. Quality problems return, often worse than before, leading to even more inspection. This creates a vicious cycle where the solution actually reinforces the problem it was meant to solve. Linear thinking sees only the direct path from inspection to quality improvement. Systems thinking reveals the feedback loop where increased inspection reduces worker vigilance, which increases defects, which justifies more inspection.
Systems thinking matters because it helps you anticipate these unintended consequences before they occur. When you map out the causal relationships in a system, you can trace how effects propagate through multiple pathways and circle back to influence their own causes. You can identify reinforcing loops that amplify change—whether growth or decline—and balancing loops that resist change and maintain stability. You can spot delays between actions and their effects that create oscillations and instability. Most importantly, you can find leverage points where small, well-placed interventions produce disproportionately large improvements because they work with the system's structure rather than against it.
The value of systems thinking extends across virtually every domain of professional practice. In healthcare, understanding feedback between disease prevalence, screening programs, treatment capacity, and public awareness helps design more effective public health interventions. In environmental management, recognizing how population dynamics, resource consumption, pollution, and ecosystem health interact enables better sustainability strategies. In business, seeing how product quality, customer satisfaction, word-of-mouth, sales, and investment in quality improvement form interconnected loops reveals why some companies thrive while others struggle despite similar resources. In education, mapping relationships between student engagement, teacher effectiveness, administrative support, and learning outcomes illuminates why school reform efforts often fail to produce lasting change.
Research across multiple disciplines confirms that systems thinking skills improve decision-making quality and problem-solving effectiveness. Studies in organizational behavior show that managers who think systemically make better strategic decisions and anticipate competitive dynamics more accurately[1]. Research in public policy demonstrates that interventions designed with systems perspectives achieve better outcomes and fewer unintended consequences than those based on linear models[2]. Evidence from education indicates that students trained in systems thinking develop stronger analytical and critical thinking capabilities that transfer across domains[3].
Despite its proven value, systems thinking remains underutilized in practice because many professionals lack concrete tools to apply it. Abstract exhortations to "think systemically" or "consider the big picture" provide little practical guidance. You need specific methods that translate systems thinking principles into actionable analytical processes. Causal loop diagramming provides exactly that—a structured methodology with clear notation, established conventions, and proven techniques that you can learn systematically and apply immediately. It transforms systems thinking from an abstract philosophy into a practical skill set that produces tangible results in real-world situations.
The power of causal loop diagramming lies not just in the final diagrams you create but in the process of creating them. When you work through the discipline of identifying variables, specifying relationships, determining polarities, and tracing feedback loops, you're forced to make your assumptions explicit and test your understanding rigorously. Gaps in your knowledge become visible. Contradictions in your reasoning surface. Alternative explanations emerge. This process of externalization—getting your mental models out of your head and onto paper where you can examine them critically—often proves more valuable than any single insight the finished diagram reveals. It's a form of structured thinking that systematically improves the quality of your analysis.
Systems thinking through causal loop diagramming also enhances collaboration and communication. When teams work together to build diagrams, they create shared understanding that transcends individual perspectives. Different stakeholders bring different mental models to complex problems—marketing sees customer dynamics one way, operations sees them another, finance has yet another view. Causal loop diagrams provide a common language that integrates these perspectives into coherent wholes. They make disagreements explicit and productive rather than implicit and divisive. They help groups move from arguing about solutions to examining assumptions about how the system works, which often reveals that apparent disagreements stem from different understandings of system structure rather than conflicting values or interests.
The need for systems thinking skills continues to grow as the problems we face become more complex and interconnected. Climate change, pandemic response, economic inequality, technological disruption, and geopolitical instability all involve feedback dynamics that span multiple domains and time scales. Addressing these challenges requires analytical approaches that can handle complexity without oversimplifying it. Causal loop diagramming won't solve these problems by itself, but it provides essential scaffolding for the kind of rigorous, holistic thinking they demand. As you develop proficiency with this methodology, you'll find yourself better equipped to understand, analyze, and influence the complex systems that shape outcomes in your professional domain.
What Are Causal Loop Diagrams?
A causal loop diagram is a visual representation of the feedback structure within a system. It consists of variables connected by causal links that show how changes in one variable influence changes in another. These links form closed loops where effects circle back to influence their own causes, creating the feedback dynamics that drive system behavior over time. The diagram uses simple notation—typically just arrows with polarity signs—to capture complex relationships in a format that's easy to read and understand. Unlike flowcharts that show sequences of events or organizational charts that show hierarchies, causal loop diagrams specifically focus on circular causality and feedback mechanisms.
The basic building blocks of causal loop diagrams are straightforward. Variables represent quantities or conditions that can change over time, such as "customer satisfaction," "inventory level," or "employee morale." Causal links are arrows connecting variables, showing that changes in one variable cause changes in another. Each link has a polarity—either positive (+) or negative (−)—indicating the direction of influence. A positive link means the variables change in the same direction: if the cause increases, the effect increases; if the cause decreases, the effect decreases. A negative link means the variables change in opposite directions: if the cause increases, the effect decreases; if the cause decreases, the effect increases. These simple elements combine to create diagrams that can represent remarkably sophisticated system dynamics.
Consider a simple example from organizational dynamics. Imagine a company where "work pressure" influences "employee stress," which influences "mistakes," which influences "rework," which circles back to influence "work pressure." This forms a closed loop. Let's trace the polarities: when work pressure increases, employee stress increases (positive link). When employee stress increases, mistakes increase (positive link). When mistakes increase, rework increases (positive link). When rework increases, work pressure increases (positive link). This loop has four positive links, making it a reinforcing loop—a vicious cycle where increasing work pressure ultimately creates even more work pressure. The diagram makes this feedback structure visible in a way that a verbal description struggles to convey clearly.
Causal loop diagrams can represent both reinforcing loops (also called positive feedback loops) and balancing loops (also called negative feedback loops). Reinforcing loops amplify change in either direction—they create growth or decline, virtuous cycles or vicious cycles. They contain an even number of negative links (including zero). Balancing loops resist change and seek equilibrium—they create stability, goal-seeking behavior, or oscillation around a target. They contain an odd number of negative links. Real systems typically contain multiple loops of both types, and understanding which loops dominate under different conditions explains why systems behave differently at different times or in different states.
The notation for causal loop diagrams follows established conventions that ensure clarity and consistency. Variables are typically written as nouns or noun phrases that describe measurable or observable quantities. Links are drawn as arrows from cause to effect, with polarity marked near the arrowhead. Loops are often labeled with an "R" for reinforcing or "B" for balancing, sometimes with numbers to distinguish multiple loops (R1, R2, B1, B2, etc.). Delays—situations where effects take significant time to manifest—are marked with small parallel lines crossing the causal link. These conventions create a shared visual language that enables people across different disciplines and organizations to read and understand each other's diagrams without extensive explanation.
What distinguishes causal loop diagrams from other systems modeling approaches is their focus on qualitative structure rather than quantitative precision. Unlike system dynamics stock-and-flow diagrams that specify exact equations and accumulations, causal loop diagrams emphasize the pattern of relationships and feedback. Unlike influence diagrams used in decision analysis that focus on probabilistic dependencies, causal loop diagrams highlight circular causality and dynamic behavior over time. Unlike concept maps that show general associations between ideas, causal loop diagrams specify directional causality and polarity. This makes them particularly useful in the early stages of system analysis when you're trying to understand overall structure before committing to detailed quantification.
The process of creating causal loop diagrams typically follows several stages. First, you define the system boundary and identify the key variables relevant to your problem or question. Second, you map the causal relationships between variables, determining which variables influence which others. Third, you assign polarities to each link based on how changes propagate. Fourth, you identify the feedback loops present in the system and classify them as reinforcing or balancing. Fifth, you refine the diagram through iteration, testing whether it accurately represents your understanding and captures the dynamics you observe. This process is rarely linear—you'll often cycle back to earlier stages as you discover gaps or inconsistencies in your initial representation.
Causal loop diagrams serve multiple purposes in research and practice. As thinking tools, they help you work through complexity by externalizing your mental models and making assumptions explicit. As communication tools, they facilitate shared understanding among stakeholders with different perspectives and expertise. As analytical tools, they enable you to trace how effects propagate through systems, identify feedback mechanisms, and predict qualitative behavior patterns. As design tools, they help you evaluate potential interventions by showing how changes in one part of the system will ripple through to other parts. As teaching tools, they make abstract systems concepts concrete and accessible to learners at various levels.
Example: A public health team studying obesity might create a causal loop diagram showing how "caloric intake" and "physical activity" influence "body weight," which influences "mobility" and "self-image," which circle back to influence "physical activity" and "caloric intake." The diagram would reveal multiple reinforcing loops—for instance, how increased body weight reduces mobility, which reduces physical activity, which increases body weight further. It would also show balancing loops—such as how increased body weight might motivate dietary changes that reduce caloric intake. This visual representation helps the team see why simple interventions often fail and where more effective leverage points might exist.
The limitations of causal loop diagrams are important to understand. They don't provide quantitative predictions about how much variables will change or exactly when effects will occur. They don't distinguish between stocks (accumulations) and flows (rates of change), which matters for precise modeling. They can become cluttered and difficult to read when systems involve dozens of variables and hundreds of links. They require judgment calls about which variables to include, how to define them, and which relationships are significant enough to represent. Despite these limitations, causal loop diagrams remain invaluable for the specific purpose they serve: revealing feedback structure and building qualitative understanding of system dynamics before investing in more detailed quantitative modeling.
As you learn to create and interpret causal loop diagrams, you'll develop a form of literacy that changes how you see the world. You'll start noticing feedback loops in everyday situations—in conversations, in news stories, in organizational dynamics, in your own behavior patterns. You'll recognize when problems stem from system structure rather than individual failures. You'll become more skeptical of simple solutions to complex problems and more curious about unintended consequences. You'll ask better questions: "What feedback loops are operating here? What delays might cause oscillation? Where are the leverage points?" This shift in perspective represents one of the most valuable outcomes of mastering causal loop diagramming—not just the ability to draw diagrams, but the development of systems thinking as a fundamental cognitive skill.
How to Use This Book
This book is structured to take you from foundational concepts through advanced techniques in a logical progression. Each chapter builds on previous material, introducing new concepts and skills while reinforcing earlier learning through application and practice. The organization reflects how people actually learn complex methodologies—not through abstract theory alone, but through a combination of conceptual understanding, concrete examples, hands-on practice, and reflection on common challenges. You can work through the book sequentially from beginning to end, or you can use it as a reference, focusing on specific chapters that address your immediate needs and returning to earlier material as necessary.
The book begins with foundations in Chapter 1, establishing the core principles of systems thinking that underlie causal loop diagramming. This chapter contrasts linear and systems thinking, introduces feedback loops at a conceptual level, and explains how stocks and flows create dynamic behavior. Even if you have some background in systems thinking, this chapter provides important context and establishes terminology used throughout the book. Chapter 2 then introduces the specific notation and conventions of causal loop diagrams—how to represent variables, causal links, polarities, and delays. This chapter is essential for everyone, as it establishes the visual language you'll use in all subsequent work.
Chapters 3 and 4 form the core skill-building section of the book. Chapter 3 focuses specifically on reinforcing and balancing loops—how to identify them, how they create different behavior patterns, and how to determine which loops dominate system behavior under different conditions. Chapter 4 walks you through the complete process of building your first causal loop diagram, from defining the problem and selecting variables through mapping relationships and constructing the final diagram. These chapters include multiple examples and practice opportunities. Work through them carefully, actually drawing diagrams rather than just reading about them. The physical act of constructing diagrams develops skills that passive reading cannot.
Chapter 5 advances to more sophisticated techniques for handling complex systems with multiple interacting loops, making decisions about system boundaries and scope, and refining diagrams through iteration. Chapter 6 addresses common pitfalls and errors that even experienced practitioners encounter—oversimplification, vague variables, missing delays, and validation problems. This chapter helps you develop critical evaluation skills so you can assess the quality of your own diagrams and those created by others. Together, these chapters move you from basic competence to genuine proficiency in causal loop diagramming methodology.
The final chapters focus on application and integration. Chapter 7 shows how to extract insights and actionable recommendations from causal loop diagrams—identifying leverage points, conducting scenario analysis, communicating findings to stakeholders, and supporting decision-making. Chapter 8 presents detailed real-world applications across multiple domains: organizational management, public health, environmental systems, and economic policy. These examples demonstrate how the same fundamental methodology adapts to very different contexts and problems. Chapter 9 explores how causal loop diagramming integrates with other research methods, both qualitative and quantitative, and how it serves as a bridge to more detailed system dynamics simulation modeling.
Throughout the book, you'll find several types of supporting material designed to enhance learning:
- Concrete examples that illustrate concepts with specific, detailed scenarios rather than abstract descriptions
- Practice exercises that give you opportunities to apply techniques to new situations and test your understanding
- Common mistakes highlighted so you can avoid pitfalls that trip up beginners and intermediate practitioners
- Tips and guidelines that capture practical wisdom from experienced practitioners
- Real-world case studies that show how causal loop diagramming has been applied to actual problems in various domains
- References and citations that point you to source material for deeper exploration of specific topics
To get the most from this book, approach it actively rather than passively. Don't just read about causal loop diagrams—draw them. Start with simple systems you understand well, then gradually tackle more complex and ambiguous situations. When you encounter examples in the text, try to extend them before reading the author's extension. When you see a diagram, cover it and try to construct it yourself based on the verbal description, then compare your version to the published one. When you finish a chapter, identify a problem from your own professional context and apply the chapter's techniques to it. This active engagement transforms abstract knowledge into practical skill.
Consider forming a study group or finding a learning partner if possible. Causal loop diagramming benefits enormously from collaborative practice. Different people see different relationships and feedback loops in the same system. Discussing why you drew a link one way while someone else drew it differently deepens understanding for everyone. Explaining your diagram to others reveals gaps in your thinking. Receiving feedback on your work accelerates improvement. Even if you can't form a formal study group, seek opportunities to share your diagrams with colleagues and incorporate their perspectives. The social dimension of learning enhances both motivation and comprehension.
The book includes a glossary of key terms and a guide to further reading and resources. Use these as you work through the material. When you encounter an unfamiliar term, check the glossary rather than guessing at its meaning. When you want to explore a topic in greater depth, consult the further reading section for recommendations. The field of system dynamics and causal loop diagramming has a rich literature spanning several decades. This book provides a solid foundation, but it's an introduction to a much larger body of knowledge. The resources section will help you continue your learning journey beyond this book.
Different readers will bring different backgrounds and goals to this material. If you're a researcher, you'll likely focus on how causal loop diagrams can strengthen your study design and analysis. If you're a manager or consultant, you'll probably emphasize applications to organizational problems and stakeholder communication. If you're a student, you might be most interested in building foundational skills and understanding theoretical underpinnings. The book is designed to serve all these audiences. Feel free to emphasize the sections most relevant to your needs while still working through the core methodology chapters that everyone requires. The examples span multiple domains specifically so that readers from different backgrounds will find relevant applications.
Finally, maintain realistic expectations about the learning process. Causal loop diagramming is not difficult, but it does require practice to develop fluency. Your first diagrams will likely be awkward and incomplete. You'll struggle with decisions about what to include and how to represent relationships. You'll create diagrams that seem clear to you but confuse others. This is normal and expected. Skill develops through iteration and feedback. Each diagram you create teaches you something that improves the next one. Each mistake you make and correct strengthens your understanding. Approach the learning process with patience and persistence, and you'll find that what initially seems challenging becomes increasingly natural and intuitive over time.
What You'll Learn and Accomplish
By working through this book systematically, you'll develop a comprehensive skill set for understanding and visualizing complex systems through causal loop diagrams. These skills operate at multiple levels—from technical proficiency with notation and conventions through conceptual understanding of feedback dynamics to strategic application in real-world contexts. The learning outcomes are both cognitive (how you think about systems) and practical (what you can do with that thinking). Together, they equip you to analyze complex problems more effectively, communicate system dynamics more clearly, and identify interventions more strategically than linear analytical approaches allow.
At the foundational level, you'll master the core concepts of systems thinking that underlie all causal loop diagramming work. You'll understand the difference between linear and circular causality, and you'll recognize situations where feedback loops create behavior patterns that simple cause-and-effect thinking cannot explain. You'll be able to distinguish between reinforcing loops that amplify change and balancing loops that resist it. You'll understand how delays between causes and effects create oscillations, overshooting, and instability. You'll grasp why system behavior often seems counterintuitive and why well-intentioned interventions frequently produce unintended consequences. These conceptual foundations change how you perceive problems and opportunities in your professional domain.
At the technical level, you'll gain proficiency with the notation and conventions of causal loop diagrams. You'll be able to:
- Identify and define appropriate variables for representing system elements
- Map causal relationships between variables with correct directionality
- Assign polarities (positive or negative) to causal links accurately
- Represent delays and time lags where they significantly affect system behavior
- Identify closed feedback loops within complex networks of relationships
- Classify loops as reinforcing or balancing based on their polarity structure
- Label and organize diagrams for clarity and effective communication
- Follow standard conventions that make your diagrams readable to others in the field
At the analytical level, you'll develop the ability to construct causal loop diagrams for real-world systems in your domain of practice. You'll learn a systematic process for moving from a problem or question through variable identification, relationship mapping, and diagram construction to a finished representation that captures essential feedback structure. You'll be able to make informed decisions about system boundaries—what to include and what to leave out—based on your analytical purpose. You'll know how to handle complexity through aggregation and decomposition strategies that keep diagrams manageable without oversimplifying. You'll be able to refine and validate diagrams through iteration, testing whether they accurately represent the system and produce insights consistent with observed behavior.
At the interpretive level, you'll learn to extract meaningful insights from causal loop diagrams once they're constructed. You'll be able to trace how effects propagate through multiple pathways and feedback loops. You'll identify which loops dominate system behavior under different conditions and predict how behavior patterns will shift as conditions change. You'll recognize leverage points—places in the system where small interventions can produce large effects because they work with feedback structure rather than against it. You'll understand why some interventions succeed while others fail or backfire. You'll be able to use diagrams for scenario analysis, exploring how systems might respond to different changes or interventions before implementing them in the real world.
At the communication level, you'll develop skills for sharing system insights with diverse audiences. You'll learn to present causal loop diagrams to stakeholders who may have no background in systems thinking, explaining feedback dynamics in accessible language. You'll be able to facilitate group diagramming sessions where multiple stakeholders contribute their perspectives to create shared understanding. You'll know how to use diagrams to make implicit assumptions explicit and to surface disagreements about how systems work in productive ways. You'll be able to translate diagram insights into actionable recommendations that decision-makers can understand and implement. These communication skills often prove as valuable as the analytical skills themselves.
Beyond these specific competencies, you'll develop broader capabilities that transfer across contexts. You'll become more comfortable with ambiguity and complexity, recognizing that useful analysis doesn't require perfect information or complete certainty. You'll develop better judgment about when systems thinking approaches add value and when simpler methods suffice. You'll become more critical in evaluating claims about causality, asking questions about feedback, delays, and unintended consequences that others overlook. You'll build confidence in your ability to tackle unfamiliar problems by applying systematic methodology rather than relying solely on domain expertise. These meta-skills enhance your effectiveness across a wide range of professional challenges.
The book also prepares you to continue learning beyond its pages. You'll understand how causal loop diagramming fits within the broader field of system dynamics and how it relates to other systems methodologies. You'll know when to advance from qualitative causal loop diagrams to quantitative stock-and-flow models and simulation. You'll be familiar with software tools that support causal loop diagramming and system dynamics modeling. You'll have references to key literature and resources for deepening your expertise in specific areas. The goal is not just to teach you what's in this book, but to equip you to continue developing your systems thinking capabilities throughout your career.
Practically speaking, completing this book enables you to accomplish several concrete outcomes in your professional work. You'll be able to create clear, accurate causal loop diagrams for problems in your domain that reveal feedback structures others miss. You'll be able to use these diagrams to improve decision-making by anticipating unintended consequences and identifying high-leverage interventions. You'll be able to facilitate more productive conversations about complex problems by giving stakeholders a shared visual language for discussing system dynamics. You'll be able to design better research studies by mapping the causal structures you're investigating before collecting data. You'll be able to communicate your findings more effectively by showing how multiple factors interact rather than just listing variables and correlations.
Perhaps most importantly, you'll develop a different relationship with complexity. Rather than feeling overwhelmed by systems with many interacting parts, you'll have tools to work through that complexity systematically. Rather than avoiding feedback and circular causality because they're difficult to think about, you'll be able to represent them explicitly and reason about their implications. Rather than settling for oversimplified linear models because they're easier to communicate, you'll be able to convey sophisticated system dynamics in accessible visual formats. This shift from seeing complexity as an obstacle to seeing it as something you can analyze and work with represents a fundamental expansion of your analytical capabilities that will serve you throughout your professional life.
Your Learning Journey: Think of this book as a guided expedition into systems thinking territory. The early chapters establish base camp with foundational concepts and basic techniques. The middle chapters take you into more challenging terrain with advanced methods and common pitfalls. The later chapters reach the summit with real-world applications and integration with other approaches. But the journey doesn't end when you finish the book—it continues as you apply these tools to your own problems, develop your own style and expertise, and discover new insights about the systems you work with. The book provides the map and the training; the ongoing practice provides the mastery.
This is the end of the free sample. The full book has 9 chapters.
Want this book written for you?
Tell us your goals and background, and get your own version of this book, tailored by AI to you.


Benefits of AI-tailored books
- Read one book, not ten:
- all the Systems Analysis knowledge you need, gathered into a single book.
- Save days of learning:
- tell us your goals, choose your topics, and the whole book is built around them.
- Learn effortlessly:
- Systems Analysis book written for your specific background and expertise.
- Understand at a glance:
- includes charts, tables, timelines, checklists, decision trees, and more.
- Stay current:
- written the day you order it, not years ago.
- Trust what you read:
- every book is checked for accuracy, with real research when your subject needs it.
Create your unique book in 3 steps
- 1. Select your focus
Select the focus of your Systems Analysis book and share your background
- 2. Personalize your book
Specify your goals and choose sub-topics to include
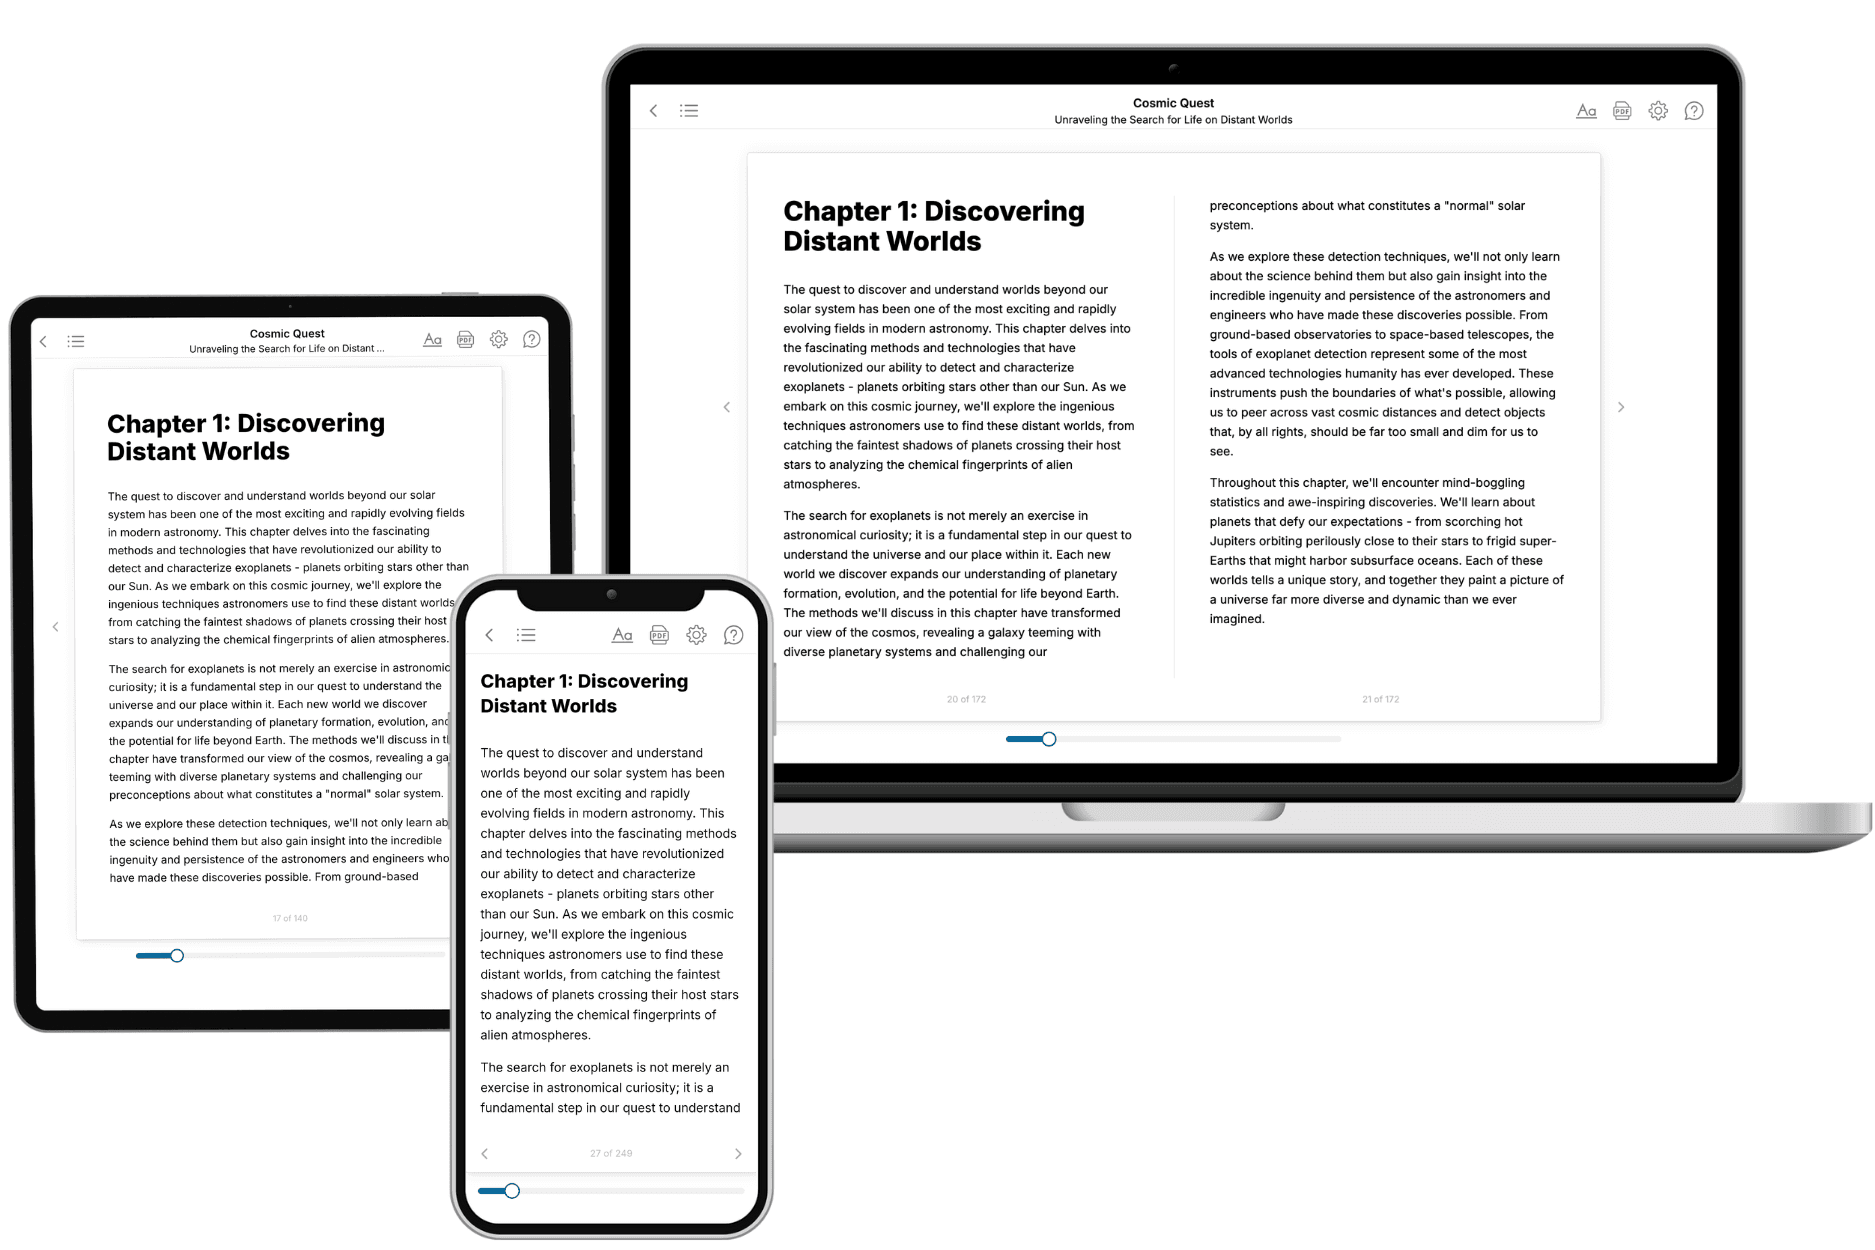
- 3. Get your tailored book
Your book is ready in 10 minutes. Read it online, download as EPUB or PDF, or send to Kindle.
Frequently asked questions
- What is TailoredRead?
TailoredRead creates complete, full-length nonfiction ebooks, written specifically for you. Tell us what you want to learn and why, and TailoredRead writes you a complete ebook on it, with charts, tables, and diagrams throughout. Read it online, on Kindle, or on any e-reader, or download it as a PDF or EPUB. Every book is written fresh the day you order it.
- How is the book tailored to me?
Before anything is written, you answer a few short questions about your goals, your background, and the topics you care about. Your book is then planned around your answers: written at your level, focused on your goals, and covering the topics you chose, instead of the one-size-fits-all book a store sells everyone.
- Will it read like generic AI content?
No. Your book isn't a chat transcript: it's planned chapter by chapter before a single word is written, told in a clear book voice, and explains ideas visually with charts, tables, and diagrams. After writing, every book goes through an editorial pass that polishes chapters so the book reads consistent from start to finish. Judge for yourself: browse thousands of sample books on our Explore Books page.
- How accurate is the content?
Our AI first checks whether your subject needs live research. Niche and fast-moving subjects are researched before writing, and the book plan and chapters are grounded in what it finds. After writing, every book goes through a quality pass that checks its facts and consistency, and researched books list their sources in a Notes section at the back.
- How long is the book?
You choose the length: Comprehensive (250-300 pages), Detailed (150-200 pages), Essential (70-100 pages), or Short (30-50 pages).
- Does the book include visuals?
Yes. Every book includes charts, tables, and diagrams: timelines, checklists, step-by-step guides, decision trees, comparison tables, matrices, and bar charts. A typical book includes dozens of these visual elements.
- Can I read it on Kindle? What formats can I download?
Yes. Every book can be read in our online reader or downloaded as a PDF or EPUB. The EPUB can be opened with Kindle, Apple Books, Kobo, and any e-reader. The Commercial and Author licenses also include an editable Word (DOCX) and Markdown download.
- How much does it cost?
About the price of a regular ebook. The exact price depends on your book's length and complexity, from $2 for the shortest books to $35 for the most comprehensive, and it's shown when you review your book, before you commit to anything. Each book is a one-time purchase, yours to keep, no subscription. Licenses that let you share, teach, or publish your book range from $35.99 to $49.99.
- Can I preview the book before purchasing?
Before you pay, you'll see what your book will cover: the title, a detailed description, the estimated length, and the complete chapter-by-chapter table of contents, so you know what you're getting before you decide. The full text itself is written after you purchase.
- How long does it take to create a book?
About 10 minutes. You can start reading the opening chapters while the rest is still being written.