Maps: The Stories Behind the Lines
How Cartography Shaped Culture, Power, and Our Understanding of the World
What if the map you've been looking at your entire life has been subtly distorting your understanding of the world?
222 pages11 chaptersMay 10, 2026CartographyCreated by Maleah
About this book
Maps are everywhere—on our phones, in classrooms, hanging on office walls—yet we rarely stop to ask who created them, why they made certain choices, or what those choices reveal about power and culture. This book takes you on a visual journey through centuries of cartography, exploring how maps have shaped exploration, colonization, trade, and identity. You'll discover how the Mercator projection became the global standard despite its significant distortions, learn about the sophisticated territorial systems Indigenous peoples developed, and uncover the mythical geographies that captured human imagination. From the Silk Road trade routes to forgotten cities, from urban planning visions to environmental transformations, maps tell stories that go far beyond geography. By the end, you'll see maps as cultural documents that reveal the values, fears, and ambitions of the societies that created them—and you'll never look at a map the same way again.
Table of contents
- IntroductionWhy Maps Matter More Than You Think, Maps as Cultural Documents, How to Read This BookRead below
- Chapter 1: The Foundations of CartographyAncient Mapping Systems and Early Representations, The Evolution of Cartographic Techniques, Maps as Both Science and Art
- Chapter 2: Projections and DistortionsThe Mercator Projection and Its Global Dominance, How Distortions Shape Our Perception, Alternative Projections and Different Perspectives
- Chapter 3: Indigenous Territorial MappingPre-Colonial Mapping Systems, Different Ways of Representing Knowledge and Space, The Lasting Legacy of Indigenous Cartography
- Chapter 4: Maps, Exploration, and Geopolitical PowerMaps During the Age of Exploration, Mapping as a Tool of Colonization, How Maps Created and Contested Borders
- Chapter 5: Trade Routes and Geographic NetworksThe Silk Road and Historical Trade Route Mapping, How Trade Maps Reveal Cultural Exchange, Visualizing Complex Networks Through Maps
- Chapter 6: Mythical Geography and Lost CitiesLegendary Places on Historical Maps, Lost Cities, Geographic Myths, and Imagination, The Intersection of Myth and Reality in Cartography
- Chapter 7: Visual Design and Cartographic SymbolismDesign Choices and Their Meanings, Symbols, Colors, and Visual Language, Graphic Design Principles in Modern Cartography
- Chapter 8: Cultural Landscapes and Regional IdentityRepresenting Cultural Landscapes on Maps, How Maps Shape and Reflect Regional Identity, The Meaning of Place Through Cartographic Representation
- Chapter 9: Urban Planning and the Visual Evolution of CitiesHistorical City Maps and Urban Development, Urban Planning Visions and Their Cartographic Expression, Modern Cities and the Maps That Shape Them
- Chapter 10: Environmental Change and Geographic VisualizationVisualizing Landscape Transformation Over Time, Mapping Human Impact on Natural Systems, Climate, Environment, and Cartographic Communication
- Chapter 11: Maps as Visual StorytellingHow Maps Tell Stories, Maps in Popular Culture and Media, Engaging Audiences Through Cartographic Narratives
- ConclusionBecoming a Critical Map Reader, The Future of Maps and Cartography
- Further Reading and Resources
Introduction
Pick up your phone and open a maps app. Within seconds, a detailed image of your surroundings appears: streets labeled, buildings outlined, parks shaded green, water shown in blue. It feels completely natural, almost invisible. But stop for a moment and ask a simple question: who decided what to include, what to leave out, and how to show it? That question, as straightforward as it sounds, opens a door into one of the most fascinating and underexplored areas of human history. Maps are not windows onto the world. They are arguments about it.
Throughout history, maps have done far more than help people find their way from one place to another. They have defined empires, justified conquests, erased entire cultures, and shaped how billions of people understand their place in the world. A map drawn in sixteenth-century Europe looked nothing like one drawn by a Pacific Islander navigating open ocean, or by an Indigenous community in the Amazon marking sacred land. Each of those maps reflected a completely different set of values, priorities, and ways of knowing. None of them was simply "correct." All of them told a story.
This book is an invitation to look at maps differently. Instead of treating them as neutral tools, you will learn to read them as cultural documents, the way a historian reads a letter or an art critic reads a painting. Every line, color, label, and projection carries meaning. Every choice a mapmaker makes reveals something about the world they lived in, the power they held or served, and the story they wanted to tell. By the time you finish this book, you will never look at a map the same way again. That is not a promise made lightly. It is what happens when you start asking the right questions.
Why Maps Matter More Than You Think
Most people encounter maps dozens of times a day without giving them a second thought. Navigation apps guide commutes. Weather maps appear on the evening news. Political maps hang in classrooms. Online maps help people find restaurants, track deliveries, and explore unfamiliar cities. Maps have become so embedded in daily life that they feel as natural and neutral as a photograph. But a photograph is not neutral either, and neither is a map. Both involve choices about framing, emphasis, and what gets left out of the frame entirely.
The stakes of those choices are surprisingly high. Consider the Mercator projection, the rectangular world map that has appeared in classrooms across the globe for centuries. It was designed in 1569 by Flemish cartographer Gerardus Mercator primarily to help sailors navigate straight-line routes across oceans. It was never intended to represent the relative sizes of countries accurately. Yet it became the dominant image of the world for most people alive today. On a Mercator map, Greenland appears roughly the same size as Africa. In reality, Africa is about fourteen times larger.[1] That single distortion has quietly shaped how generations of people perceive global geography and, by extension, global importance.
Maps also carry enormous political weight. When a government draws a border on a map, that line can determine who belongs to a nation and who does not, which communities receive resources and which are ignored, and whose history gets written into the landscape. The borders drawn across Africa during the 1884 Berlin Conference, largely by European powers who had never set foot in the regions they were dividing, created political boundaries that cut across ethnic groups, trade networks, and cultural territories. Those lines on a map produced consequences that continue to shape the continent today.[2]
Even the simple act of naming places on a map is a political act. When European colonizers arrived in new territories, they frequently renamed rivers, mountains, and entire regions, erasing Indigenous place names that had existed for thousands of years. Those original names were not just labels. They encoded ecological knowledge, spiritual significance, and historical memory. Replacing them with European names was a way of claiming ownership not just over land, but over meaning itself. Many countries today are actively working to restore Indigenous place names, recognizing that maps are one of the most powerful tools for reclaiming cultural identity.
Maps also shape behavior in ways that are easy to overlook. Urban planners use maps to decide where to build highways, schools, and hospitals. Those decisions determine which neighborhoods thrive and which are cut off from opportunity. Research has shown that in many American cities, highways built during the mid-twentieth century were deliberately routed through Black and low-income neighborhoods, displacing communities and creating physical barriers that persist decades later.[3] The maps that guided those decisions were not neutral technical documents. They were expressions of social priorities and, in many cases, racial bias.
Understanding why maps matter is the first step toward reading them critically. It means recognizing that every map is made by someone, for some purpose, at a specific moment in history. It means asking not just "what does this map show?" but "who made it, why, and what does it leave out?" Those questions transform maps from passive backdrops into active participants in the stories of human civilization. That transformation is what this book is designed to help you make.
A useful habit to develop: The next time you look at any map, ask three questions before accepting what you see. First, who created this map and when? Second, what choices did they make about what to include or exclude? Third, whose perspective does this map represent, and whose does it ignore?
These questions are not meant to make you distrust every map you encounter. Maps are genuinely useful, often essential tools. The goal is to become a more informed and thoughtful map reader, someone who can appreciate both the power and the limitations of cartographic representation. That kind of critical literacy is increasingly important in a world where maps are used to communicate everything from climate data to election results to public health information.
Maps as Cultural Documents
Historians often say that to understand a society, you should look at what it chose to record and preserve. Maps are among the most revealing records any society can leave behind. They show what people knew, what they feared, what they valued, and how they understood their relationship to the land, the sea, and the cosmos. A medieval European map that places Jerusalem at the center of the world is not a geographic error. It is a theological statement. It tells you exactly what the people who made it believed about the structure of reality.
The Mappa Mundi, a famous medieval world map created around 1300 and now housed in Hereford Cathedral in England, is a perfect example of this principle. To a modern eye, it looks wildly inaccurate. Continents are misshapen, distances are wrong, and the map is populated with mythical creatures and biblical scenes. But judged by its own standards, it is a masterpiece. It was not designed to help anyone navigate. It was designed to represent the Christian understanding of history, geography, and divine order all in one image.[4] Understanding that purpose completely changes how you read it.
Different cultures have produced radically different kinds of maps, each reflecting a distinct way of understanding space and place. The Marshall Islanders of the Pacific created stick charts from palm ribs and shells that encoded the patterns of ocean swells and island positions. These were not drawn on paper and were not meant to be carried on voyages. They were teaching tools, used to train navigators to feel the ocean's movements with their bodies.[5] That approach to spatial knowledge is fundamentally different from the European tradition of drawing lines on paper, and it is no less sophisticated.
Indigenous communities across North America developed detailed territorial maps that encoded not just physical geography but also seasonal patterns, spiritual relationships with the land, and community boundaries established through generations of use and negotiation. The Inuit of the Arctic created maps from memory that accurately represented coastlines over hundreds of miles, using a spatial knowledge system built through lived experience rather than surveying instruments. When European explorers arrived and declared these territories "unmapped," they were not describing a geographic reality. They were revealing their own inability to recognize mapping systems that looked different from their own.
Even within the European tradition, maps changed dramatically as culture and technology evolved. Renaissance maps celebrated the rediscovery of classical knowledge and the excitement of new exploration. Enlightenment maps emphasized scientific measurement and rational order. Colonial maps asserted ownership and control over distant territories. Each era produced maps that reflected its dominant values and anxieties. Reading those maps as cultural documents means paying attention to what they celebrate, what they fear, and what they choose to make invisible.
The cultural dimension of maps extends into the present day. Consider how different countries represent disputed territories. A map published in China shows the South China Sea very differently from one published in Vietnam or the Philippines. A map of Israel and Palestine looks different depending on who produced it and for what audience. These are not simply cases of one map being right and another being wrong. They are cases of competing narratives about history, sovereignty, and identity being expressed through cartographic choices. Recognizing that maps can carry competing truths simultaneously is one of the most important skills this book aims to develop.
Maps also function as cultural memory. Place names, boundaries, and the features chosen for representation all encode a community's history and identity. When a map labels a river by its Indigenous name rather than the name given by European settlers, it is making a statement about whose history matters. When a map includes a neighborhood that was demolished decades ago, it preserves a memory that might otherwise be lost. Maps are not just records of the present. They are archives of the past and visions of the future, all compressed into a single image.
Example to consider: Compare two maps of the same city produced fifty years apart. Notice which neighborhoods are labeled, which landmarks are highlighted, and how the street network has changed. Those differences tell a story about urban development, demographic shifts, and changing social priorities that no written history could capture quite as vividly.
Treating maps as cultural documents does not require specialized training in cartography or history. It requires curiosity and a willingness to ask questions. The chapters ahead will give you the tools and the context to do exactly that, moving from ancient mapping systems to modern digital cartography, from the Silk Road to the urban grid, from mythical geographies to environmental data visualization. Each stop on that journey reveals something new about how maps and culture shape each other in ways that are still unfolding today.
How to Read This Book
This book is organized as a journey through the major themes and turning points in the history of cartography. It does not follow a strict chronological timeline from ancient to modern. Instead, each chapter focuses on a specific lens through which maps can be understood: power, culture, design, myth, trade, environment, and storytelling. That structure allows each chapter to stand on its own while also building toward a larger picture of how maps and human civilization have shaped each other across time and place.
You do not need any prior knowledge of cartography, geography, or history to get the most out of this book. The writing assumes curiosity, not expertise. Technical terms are introduced only when they genuinely help clarify an idea, and they are always explained in plain language. The goal throughout is to make complex ideas accessible without oversimplifying them. Maps are rich, layered objects, and doing them justice requires some depth. But depth does not have to mean difficulty.
Here is a brief overview of what each chapter covers, so you can navigate the book according to your interests:
- Chapter 1: The Foundations of Cartography traces the origins of mapmaking from ancient clay tablets and papyrus scrolls to the sophisticated techniques of the Renaissance, showing how the basic challenges of representing a three-dimensional world on a flat surface have driven centuries of innovation.
- Chapter 2: Projections and Distortions digs into the mathematics and politics of map projections, explaining why every flat map distorts reality and how those distortions have shaped global perceptions of size, importance, and power.
- Chapter 3: Indigenous Territorial Mapping explores the sophisticated spatial knowledge systems developed by Indigenous peoples around the world, challenging the assumption that European cartography was the only valid form of geographic knowledge.
- Chapter 4: Maps, Exploration, and Geopolitical Power examines how maps were used during the Age of Exploration to claim, divide, and control territories, and how those cartographic decisions created political realities that persist today.
- Chapter 5: Trade Routes and Geographic Networks follows the great trade routes of history, from the Silk Road to the spice routes of the Indian Ocean, showing how maps both reflected and enabled the movement of goods, ideas, and cultures across vast distances.
- Chapter 6: Mythical Geography and Lost Cities investigates the legendary places that appeared on historical maps, from El Dorado to the Mountains of the Moon, exploring what those imagined geographies reveal about human curiosity, fear, and the desire for discovery.
- Chapter 7: Visual Design and Cartographic Symbolism breaks down the visual language of maps, explaining how choices about color, symbol, scale, and typography shape the way information is perceived and interpreted.
- Chapter 8: Cultural Landscapes and Regional Identity looks at how maps both reflect and construct regional identities, showing how the act of mapping a landscape is also an act of defining who belongs to it.
- Chapter 9: Urban Planning and the Visual Evolution of Cities traces the history of city maps and urban planning documents, revealing how visions of the ideal city have been expressed, debated, and sometimes imposed through cartographic representation.
- Chapter 10: Environmental Change and Geographic Visualization explores how maps have been used to track and communicate environmental transformation, from deforestation and desertification to rising sea levels and shifting climate zones.
- Chapter 11: Maps as Visual Storytelling examines how maps function as narrative tools in literature, film, journalism, and popular culture, and what makes a map genuinely compelling as a piece of communication.
Each chapter is designed to be read in sequence, but the book also works well as a reference you can dip into based on what interests you most. If you are drawn to questions of power and politics, Chapters 2, 3, and 4 will be especially rewarding. If you are more interested in design and visual communication, Chapters 7 and 11 offer the most direct engagement with those themes. If history and exploration are your primary interests, Chapters 1, 4, 5, and 6 form a natural arc.
Throughout the book, you will find concrete examples drawn from specific maps, specific historical moments, and specific communities. The goal is always to ground abstract ideas in real, tangible cases. When the book discusses how maps distort perception, it will show you exactly which maps, which distortions, and what the consequences have been. When it discusses Indigenous mapping systems, it will describe specific communities and specific practices, not vague generalizations. That specificity is what makes the ideas stick.
You will also find practical frameworks for reading maps critically scattered throughout the chapters. These are not academic exercises. They are tools you can apply immediately to any map you encounter, whether it is a historical artifact in a museum, a political map in a news article, or the navigation app on your phone. Developing that critical reading habit is one of the most practical outcomes this book aims to deliver.
A note on the maps discussed in this book: Many of the historical maps referenced throughout these chapters are available to view online through institutions like the David Rumsey Map Collection, the Library of Congress Geography and Map Division, and the British Library's digitized collections. Seeking out the actual images while reading will significantly enrich your experience of the material.
One final thought before the journey begins. Maps have a way of making the world feel fixed and settled, as if the lines and labels have always been there and always will be. But maps are made by people, and people change. The world they represent changes too. Every map is a snapshot of a particular moment in the ongoing human project of making sense of the planet we inhabit. Learning to see maps that way, as living documents rather than permanent truths, is perhaps the most important shift this book can help you make. It is a shift that opens up not just a new way of reading maps, but a new way of reading the world itself.
Notes
Introduction
- 1. Mark Monmonier, How to Lie with Maps, University of Chicago Press, 1996
- 2. Thomas Pakenham, The Scramble for Africa, Random House, 1991
- 3. Richard Rothstein, The Color of Law, Liveright Publishing, 2017
- 4. P. D. A. Harvey, Mappa Mundi: The Hereford World Map, Hereford Cathedral, 1996
- 5. David Turnbull, Maps Are Territories, University of Chicago Press, 1993
This is the end of the free sample. The full book has 11 chapters.
Want this book written for you?
Tell us your goals and background, and get your own version of this book, tailored by AI to you.


Benefits of AI-tailored books
- Read one book, not ten:
- all the Cartography knowledge you need, gathered into a single book.
- Save days of learning:
- tell us your goals, choose your topics, and the whole book is built around them.
- Learn effortlessly:
- Cartography book written for your specific background and expertise.
- Understand at a glance:
- includes charts, tables, timelines, checklists, decision trees, and more.
- Stay current:
- written the day you order it, not years ago.
- Trust what you read:
- every book is checked for accuracy, with real research when your subject needs it.
Create your unique book in 3 steps
- 1. Select your focus
Select the focus of your Cartography book and share your background
- 2. Personalize your book
Specify your goals and choose sub-topics to include
- 3. Get your tailored book
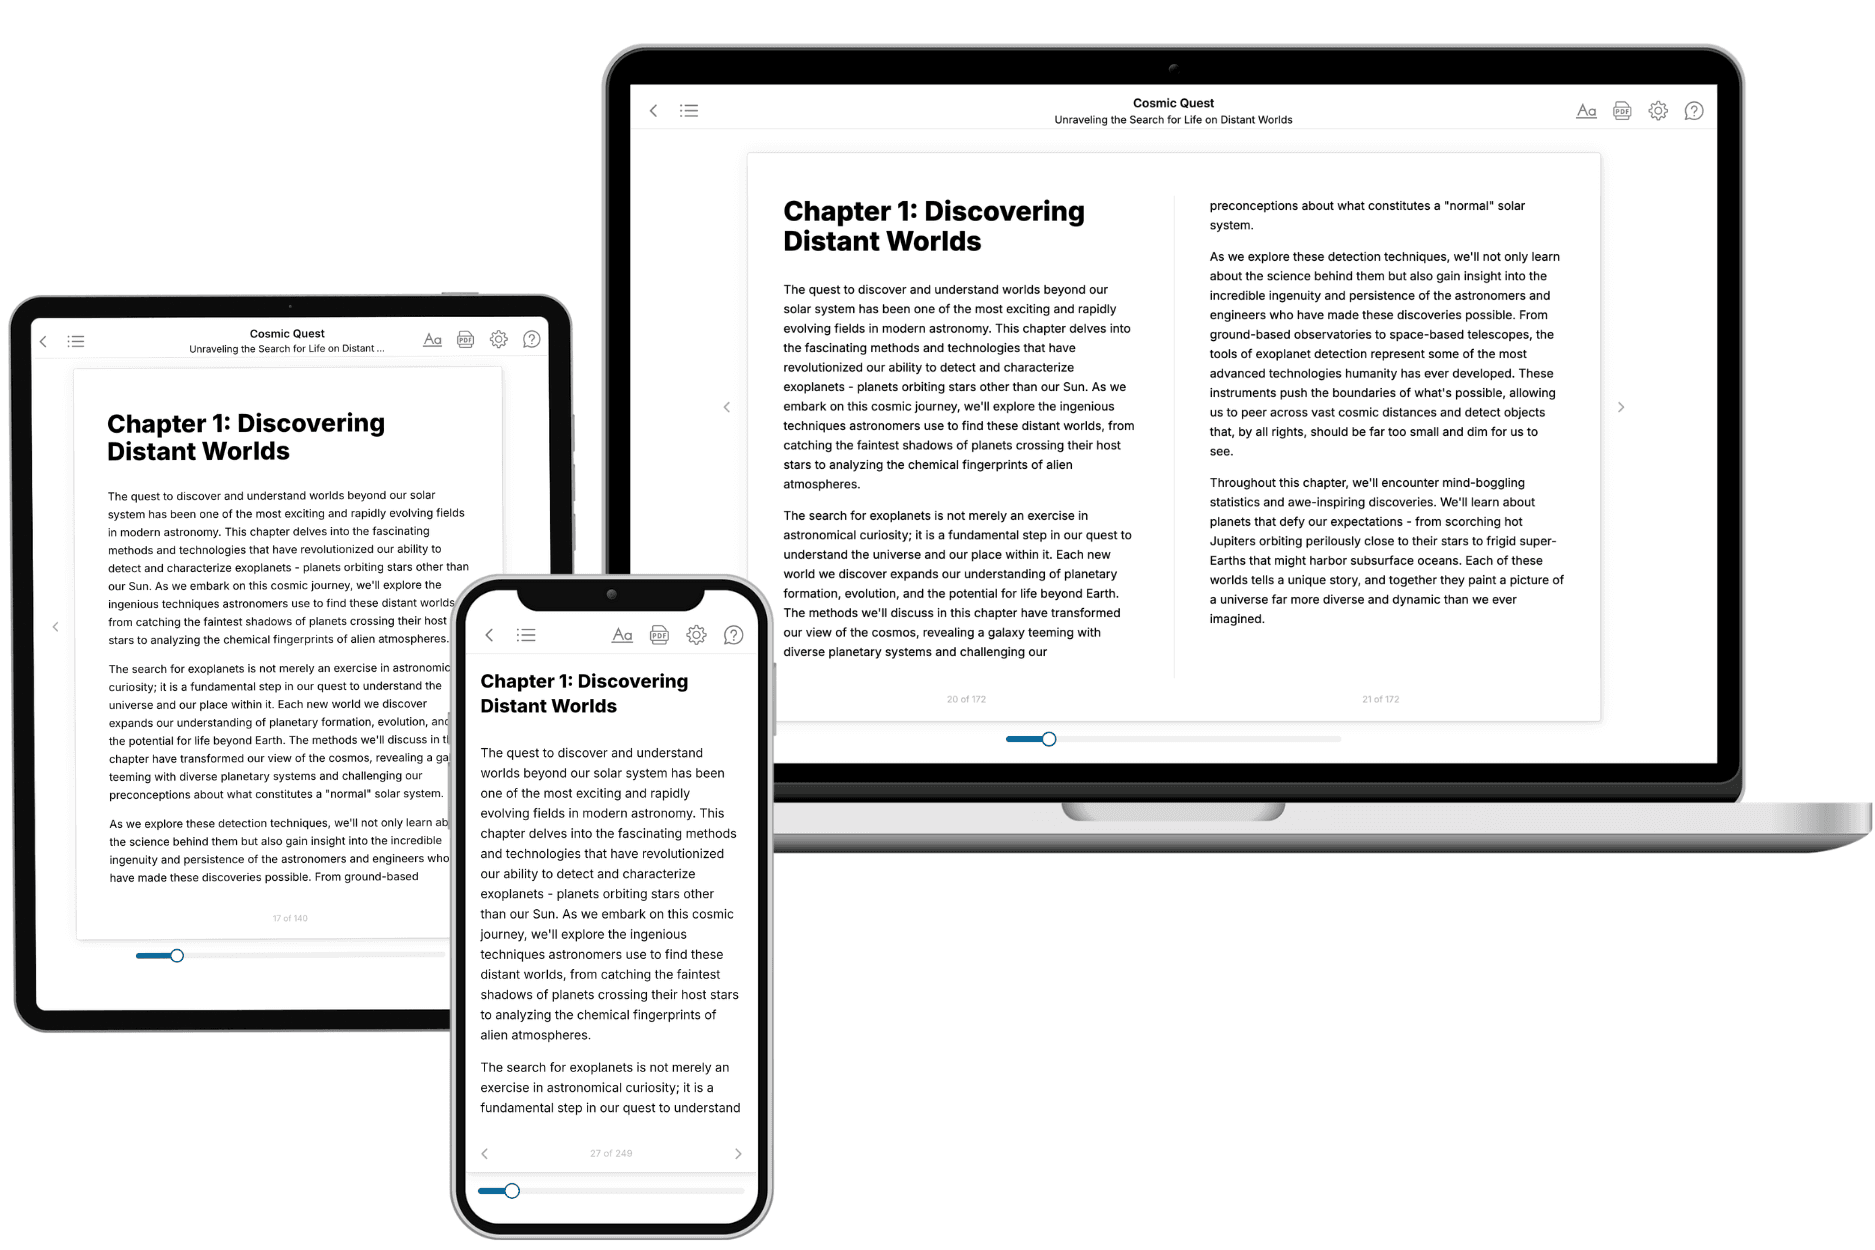
Your book is ready in 10 minutes. Read it online, download as EPUB or PDF, or send to Kindle.
Frequently asked questions
- What is TailoredRead?
TailoredRead creates complete, full-length nonfiction ebooks, written specifically for you. Tell us what you want to learn and why, and TailoredRead writes you a complete ebook on it, with charts, tables, and diagrams throughout. Read it online, on Kindle, or on any e-reader, or download it as a PDF or EPUB. Every book is written fresh the day you order it.
- How is the book tailored to me?
Before anything is written, you answer a few short questions about your goals, your background, and the topics you care about. Your book is then planned around your answers: written at your level, focused on your goals, and covering the topics you chose, instead of the one-size-fits-all book a store sells everyone.
- Will it read like generic AI content?
No. Your book isn't a chat transcript: it's planned chapter by chapter before a single word is written, told in a clear book voice, and explains ideas visually with charts, tables, and diagrams. After writing, every book goes through an editorial pass that polishes chapters so the book reads consistent from start to finish. Judge for yourself: browse thousands of sample books on our Explore Books page.
- How accurate is the content?
Our AI first checks whether your subject needs live research. Niche and fast-moving subjects are researched before writing, and the book plan and chapters are grounded in what it finds. After writing, every book goes through a quality pass that checks its facts and consistency, and researched books list their sources in a Notes section at the back.
- How long is the book?
You choose the length: Comprehensive (250-300 pages), Detailed (150-200 pages), Essential (70-100 pages), or Short (30-50 pages).
- Does the book include visuals?
Yes. Every book includes charts, tables, and diagrams: timelines, checklists, step-by-step guides, decision trees, comparison tables, matrices, and bar charts. A typical book includes dozens of these visual elements.
- Can I read it on Kindle? What formats can I download?
Yes. Every book can be read in our online reader or downloaded as a PDF or EPUB. The EPUB can be opened with Kindle, Apple Books, Kobo, and any e-reader. The Commercial and Author licenses also include an editable Word (DOCX) and Markdown download.
- How much does it cost?
About the price of a regular ebook. The exact price depends on your book's length and complexity, from $2 for the shortest books to $35 for the most comprehensive, and it's shown when you review your book, before you commit to anything. Each book is a one-time purchase, yours to keep, no subscription. Licenses that let you share, teach, or publish your book range from $35.99 to $49.99.
- Can I preview the book before purchasing?
Before you pay, you'll see what your book will cover: the title, a detailed description, the estimated length, and the complete chapter-by-chapter table of contents, so you know what you're getting before you decide. The full text itself is written after you purchase.
- How long does it take to create a book?
About 10 minutes. You can start reading the opening chapters while the rest is still being written.