The Structural Integrity of Price
A Technical Framework for Swing Trading Success
What if the markets operate with the same structural logic as the buildings you design or the financial systems you audit?
191 pages9 chaptersMay 11, 2026Stock Trading
About this book
This book reveals how price movements follow predictable architectural patterns that can be mapped, analyzed, and traded systematically. Rather than chasing random price movements, you'll learn to identify the structural integrity of price through market structure analysis, support and resistance mapping, and price action patterns. Drawing on your background in technical auditing and cost analysis, you'll discover how to apply systematic frameworks to swing trading—from analyzing order flow and liquidity zones to optimizing risk-reward ratios and position sizing. This isn't about predicting the future; it's about understanding the structural foundations that drive price behavior. You'll develop a comprehensive trading plan, master entry and exit strategies, and build the disciplined habits that separate consistent traders from those who rely on luck. By treating markets as systems to be audited rather than puzzles to be solved, you'll gain the confidence to execute trades with precision and accountability.
Table of contents
- IntroductionWhy Structure Matters in Trading, Your Analytical Advantage as an Auditor, How to Use This BookRead below
- Chapter 1: Market Structure FoundationsUnderstanding Market Structure Patterns, Price as Structural Blueprints, Identifying Market Phases and Cycles
- Chapter 2: Price Action Analysis EssentialsCandlestick Pattern Recognition, Volume Profile and Market Participation, Order Flow Analysis Fundamentals
- Chapter 3: Support and Resistance MappingIdentifying Support and Resistance Levels, Swing High and Low Mapping Techniques, Structural Zones and Price Behavior
- Chapter 4: Trend Identification and AnalysisTrend Identification Methods, Market Microstructure and Trend Dynamics, Confirming Trends with Multiple Timeframes
- Chapter 5: Breakout and Pullback Trading MechanicsBreakout Trading Mechanics, Pullback Entry Techniques, Liquidity Zone Identification and Exploitation
- Chapter 6: Risk Management FrameworkRisk Management Techniques and Principles, Risk-Reward Ratio Optimization, Position Sizing Strategies
- Chapter 7: Building Your Trading Plan FrameworkStructural Frameworks for Trading Plans, Entry and Exit Strategy Development, Profit Taking and Trade Management Strategies
- Chapter 8: Cost-Benefit Analysis in TradingApplying Audit Skills to Trading Decisions, Cost-Benefit Analysis Trading Framework, Expected Value and Trade Validation
- Chapter 9: Discipline, Emotion, and ExecutionBuilding Disciplined Trading Habits, Emotional Control and Decision-Making, Trade Journaling Systems and Performance Audits
- ConclusionIntegrating Your Complete Trading Framework, Your Path Forward
- Appendix: Quick Reference GuidesPattern Recognition Checklist, Risk Calculation Templates, Trading Plan Template
Introduction
Every structure has integrity, or it doesn't stand. A bridge that looks solid from the outside but has compromised load-bearing joints will eventually fail under pressure. A financial audit that appears clean on the surface but ignores irregular cash flows will miss the fraud hiding in plain sight. Markets work the same way. Price movements that seem chaotic and unpredictable to the untrained eye are, in fact, governed by structural forces that repeat themselves with remarkable consistency. The question isn't whether those patterns exist. The question is whether you have the right framework to see them.
This book was built for people who think in systems. If your professional background involves auditing financial records, analyzing cost structures, or verifying the integrity of complex data, you already possess a set of cognitive tools that most retail traders never develop. You know how to look past surface-level numbers and find the underlying logic. You understand that anomalies are signals, not noise. You recognize that a well-documented process produces more reliable outcomes than intuition alone. These are not soft skills. They are the exact competencies that separate disciplined traders from gamblers.
Swing trading, at its core, is about capturing intermediate price movements within a larger trend. It's not day trading, where you're glued to a screen watching every tick. It's not long-term investing, where you buy and hold for years. Swing trading occupies the middle ground, typically holding positions for two days to several weeks, targeting meaningful price moves that develop as market structure evolves. This timeframe is particularly well-suited to analytical thinkers because it allows time for proper analysis, deliberate decision-making, and systematic review without the frantic pace of intraday trading.
The framework presented throughout this book treats price charts the way an auditor treats a set of financial statements. Every candlestick is a data point. Every support and resistance level is a structural boundary. Every breakout or pullback is an event to be verified against multiple criteria before action is taken. Nothing is assumed. Everything is tested. This approach won't make trading feel exciting or impulsive. It will make it feel methodical, which is exactly the point. Consistent profitability in markets comes from process, not from prediction.
Before diving into the technical content, it's worth being direct about what this book is and what it isn't. It is a framework for developing analytical skills, building a structured trading plan, and applying systematic thinking to price action. It is not a source of specific investment advice, stock picks, or guaranteed outcomes. Markets carry real financial risk, and no framework eliminates that risk entirely. What a good framework does is help you understand and manage that risk with clarity and discipline. Every concept in this book is designed to help you make better-informed decisions, not to make decisions for you.
Why Structure Matters in Trading
Most people who lose money in markets do so not because they lack intelligence, but because they lack structure. They enter trades based on tips, headlines, or gut feelings. They exit too early when a trade moves against them slightly, or they hold too long hoping a losing position will recover. They have no defined rules for when to act and when to wait. Without structure, every trading decision becomes a fresh emotional battle, and emotions are notoriously poor financial advisors.
Structure in trading means having a defined set of conditions that must be met before any action is taken. Think of it like a pre-flight checklist. A pilot doesn't decide whether to check the fuel gauge based on how confident they feel that morning. The checklist exists precisely because confidence is not a reliable substitute for verification. In trading, your structural checklist might include confirming the trend direction, identifying a key support or resistance level, waiting for a specific candlestick signal, and verifying that the risk-reward ratio meets your minimum threshold. Only when all conditions are met does a trade get executed.
The concept of structural integrity in price refers to the degree to which a price level, trend, or pattern is supported by multiple confirming factors. A support level that has been tested three times and held, that aligns with a major moving average, and that sits at a historically significant price zone has high structural integrity. A support level that was touched once and hasn't been retested has low structural integrity. The difference matters enormously when you're deciding whether to risk capital at that level.
Research into trader behavior consistently shows that the majority of retail traders underperform the market not because of poor stock selection, but because of poor trade management.[1] They buy at the wrong time in the cycle, size positions too large relative to their account, and abandon their plans the moment volatility increases. A structural framework addresses all three of these failure points by defining entry timing, position sizing rules, and exit criteria in advance.
Consider a concrete example. Imagine a stock that has been trending upward for several months, making higher highs and higher lows. It pulls back to a previous swing high that has now become support, and that level also coincides with a 50-period moving average. Volume during the pullback is declining, suggesting sellers are losing conviction. A bullish candlestick pattern forms at that level. Each of these observations is a structural data point. Together, they form a high-integrity setup. Without a structural framework, a trader might see only the recent pullback and feel nervous. With the framework, they see a confluence of supporting evidence and can act with confidence.
Structure also matters because it creates accountability. When you have documented rules and you deviate from them, you know it. You can review your trade journal and see exactly where the process broke down. This kind of audit trail is something technical professionals understand intuitively. In financial auditing, deviations from procedure are flagged and investigated. In trading, deviations from your plan should be treated the same way. The goal isn't perfection. The goal is a process that can be reviewed, refined, and improved over time.
Markets are not random, but they are complex. Price movements reflect the collective decisions of millions of participants, from individual retail traders to large institutional funds managing billions of dollars. Within that complexity, structural patterns emerge because human psychology is consistent. Fear and greed manifest in predictable ways at predictable price levels. Support and resistance zones form because large numbers of participants made decisions at those prices and remember them. Understanding these structural dynamics doesn't give you a crystal ball. It gives you a probability edge, and in trading, a consistent edge is all you need.
Key principle: Structure doesn't predict the future. It identifies the conditions under which certain outcomes become more probable than others. Your job as a trader is to find those conditions, act when they align, and manage risk when they don't.
Your Analytical Advantage as an Auditor
If you've spent years working as a technical auditor or cost analyst, you've been training for systematic trading without realizing it. The cognitive habits that make someone effective in those roles, including attention to detail, skepticism toward surface-level data, comfort with structured frameworks, and the ability to identify anomalies in complex datasets, translate directly into trading competencies. This isn't a metaphor. These are literal skill transfers.
Consider what an auditor does when reviewing a set of financial statements. They don't simply accept the numbers at face value. They look for internal consistency. They check whether the cash flow statement aligns with the income statement. They flag unusual variances and investigate their causes. They apply materiality thresholds to determine which discrepancies warrant deeper investigation. Now consider what a skilled price action trader does when analyzing a chart. They look for internal consistency in the price structure. They check whether volume confirms the price movement. They flag unusual price behavior at key levels and investigate the context. They apply significance thresholds to determine which patterns warrant a trade. The process is structurally identical.
Cost analysts bring an additional advantage: comfort with expected value calculations. In cost analysis, you routinely evaluate whether a project or expenditure is justified by its expected return, accounting for probability-weighted outcomes and uncertainty ranges. This is precisely the mental model required for evaluating trades. A trade with a 40% win rate can be highly profitable if the average winner is 2.5 times larger than the average loser. A trade with a 70% win rate can be a long-term money loser if the average loss is 3 times larger than the average gain. Understanding this math intuitively, as cost analysts do, is a genuine edge over traders who focus only on win rates.
There are also some habits from analytical work that need to be consciously adapted for trading. In auditing, the goal is often to achieve certainty before drawing a conclusion. In trading, certainty is never available. You are always working with probabilities, and waiting for certainty means missing every trade. The adaptation required is learning to act decisively on high-probability setups while accepting that some percentage of those setups will fail. This is not a contradiction of analytical rigor. It is the application of statistical thinking to decision-making under uncertainty.
Another adaptation involves the relationship with being wrong. In professional analytical work, errors are serious. A miscalculation in a cost report or an oversight in an audit can have significant professional consequences. This creates a natural aversion to being wrong that can be paralyzing in trading. In markets, being wrong on individual trades is not only acceptable, it's inevitable. The goal is not to be right on every trade. The goal is to be right often enough, and by enough of a margin, that the overall system produces positive returns. Reframing "being wrong" as "a normal cost of doing business" is one of the most important mental shifts for analytically trained traders.
Here is a direct comparison of how analytical skills map to trading competencies:
- Variance analysis maps to identifying price deviations from expected structural behavior at key levels
- Internal consistency checks map to confirming that price action, volume, and market structure all align before entering a trade
- Materiality thresholds map to minimum risk-reward ratios and setup quality filters that determine whether a trade is worth taking
- Audit trails and documentation map to trade journaling and performance review processes
- Expected value modeling maps directly to calculating the expected value of a trade based on win rate and risk-reward ratio
- Process compliance monitoring maps to reviewing whether trades were executed according to the defined trading plan
The analytical advantage also extends to how you handle data. Many retail traders are overwhelmed by the volume of information available in financial markets. News feeds, social media commentary, analyst reports, and economic data all compete for attention. Experienced auditors and analysts are trained to filter signal from noise, to identify which data points are actually relevant to the question being asked and which are distractions. In trading, this skill helps you stay focused on the price structure and key technical levels rather than getting pulled into the narrative of the day.
One practical example of this advantage in action: imagine a stock that has been in a strong uptrend. A major news outlet publishes a negative article about the company's industry. Many retail traders panic and sell. An analytically trained trader looks at the price chart and asks a different question: has the structural integrity of the uptrend been compromised? If the price is still making higher highs and higher lows, if it's still above key support levels, and if volume on the decline is below average, the structural answer is no. The news is noise. The structure is intact. This kind of disciplined filtering is where your background gives you a real, measurable edge.
How to Use This Book
This book is organized as a progressive framework, meaning each chapter builds on the concepts introduced in the previous one. The sequence is intentional. You won't find risk management buried in the final chapters as an afterthought. It appears early and runs as a thread throughout the entire book because risk management is not a separate topic in trading. It is the foundation on which everything else is built. Similarly, the trading plan chapter comes after the technical analysis chapters because a plan without technical knowledge is incomplete, but technical knowledge without a plan is dangerous.
Here is a brief overview of what each section covers and how the pieces connect:
- Chapters 1 through 3 cover the foundational analytical layer: market structure, price action, and support and resistance mapping. These chapters establish the vocabulary and visual framework you'll use throughout the rest of the book. Spend time here. The concepts are not complicated, but they need to become second nature before you move forward.
- Chapters 4 and 5 build on that foundation by introducing trend identification and the mechanics of breakout and pullback trading. These are the core trade setups that the entire framework is designed to capture. Understanding them deeply is essential before moving to execution.
- Chapter 6 covers risk management in detail, including position sizing and risk-reward optimization. Even if you're tempted to skip ahead to the exciting parts, don't skip this chapter. Risk management is what keeps you in the game long enough for your edge to play out.
- Chapters 7 and 8 address trading plan development and cost-benefit analysis. These chapters are where your analytical background will feel most directly applicable. They translate the technical concepts into a structured decision-making system.
- Chapter 9 covers the psychological and behavioral side of trading, including discipline, emotional control, and trade journaling. This is often the chapter that analytically trained people are most tempted to skip, assuming they already have these skills. Read it anyway. The application to trading has specific nuances that are worth understanding.
For the best results, approach this book the way you would approach a new audit engagement. Read through the entire framework first to understand the scope and structure. Then go back and work through each chapter in detail, taking notes and applying the concepts to real charts as you go. The appendix at the back of the book contains quick-reference guides, including a pattern recognition checklist, risk calculation templates, and a trading plan template. These are designed to be used actively, not just read once and forgotten.
A note on practice: reading about trading and actually trading are very different experiences. The concepts in this book will make intellectual sense fairly quickly. Applying them under real market conditions, when money is on the line and prices are moving, is a different challenge entirely. Before committing real capital, consider practicing on a paper trading account or a trading simulator. Most major brokerage platforms offer this feature at no cost. Use it to build familiarity with the framework before the stakes are real. There is no shame in this process. Professional pilots spend hundreds of hours in simulators before flying passengers. The same logic applies here.
Throughout the book, you'll encounter specific frameworks and checklists designed to make the concepts actionable. These are not decorative. They are the operational tools of the system. For example, the Setup Quality Checklist introduced in Chapter 5 is meant to be used before every trade, not just read once as an example. The Trade Journal Template in Chapter 9 is meant to be filled out after every trade, not just reviewed as a concept. The value of these tools comes entirely from consistent application.
It's also worth setting realistic expectations about the learning curve. Developing genuine competence in technical trading typically takes months of consistent practice, not days or weeks. Research suggests that it takes most traders between one and three years of active, deliberate practice to develop a consistently profitable approach.[2] This doesn't mean you should expect to lose money for years. It means you should approach the learning process with patience and a long-term perspective. Your analytical background will accelerate the learning curve, but it won't eliminate it entirely.
One final point about how to use this book: treat it as a starting framework, not a final answer. Markets evolve. Strategies that work well in trending markets may underperform in choppy, range-bound conditions. The specific patterns and setups described here are grounded in well-established technical analysis principles, but no single approach works perfectly in all market environments. As you gain experience, you'll develop your own refinements and adaptations. The goal of this book is to give you a solid structural foundation from which to build, not to hand you a rigid system that you follow without thinking. The best traders are always students of the market, continuously refining their understanding based on what the price structure is telling them.
A practical starting point: Before reading Chapter 1, open a free charting platform such as TradingView and pull up a daily chart of any major stock index. Look at the last 12 months of price history. Without any technical knowledge yet, simply observe: Can you identify periods where price moved strongly in one direction? Can you see places where price seemed to stop and reverse? Can you spot levels where price returned multiple times? If you can see these things intuitively, you're already beginning to see market structure. This book will give you the language and framework to analyze what you're seeing with precision.
The markets have been operating for well over a century, and the structural patterns that drive price behavior have been documented, studied, and refined by generations of traders and researchers. You don't need to reinvent the wheel. You need to understand the wheel well enough to use it effectively. That's what this book is designed to help you do. The structural integrity of price is not a mystery. It's a framework waiting to be learned. Let's begin.
This is the end of the free sample. The full book has 9 chapters.
Want this book written for you?
Tell us your goals and background, and get your own version of this book, tailored by AI to you.


Benefits of AI-tailored books
- Read one book, not ten:
- all the Stock Trading knowledge you need, gathered into a single book.
- Save days of learning:
- tell us your goals, choose your topics, and the whole book is built around them.
- Learn effortlessly:
- Stock Trading book written for your specific background and expertise.
- Understand at a glance:
- includes charts, tables, timelines, checklists, decision trees, and more.
- Stay current:
- written the day you order it, not years ago.
- Trust what you read:
- every book is checked for accuracy, with real research when your subject needs it.
Create your unique book in 3 steps
- 1. Select your focus
Select the focus of your Stock Trading book and share your background
- 2. Personalize your book
Specify your goals and choose sub-topics to include
- 3. Get your tailored book
Your book is ready in 10 minutes. Read it online, download as EPUB or PDF, or send to Kindle.


Frequently asked questions
- What is TailoredRead?
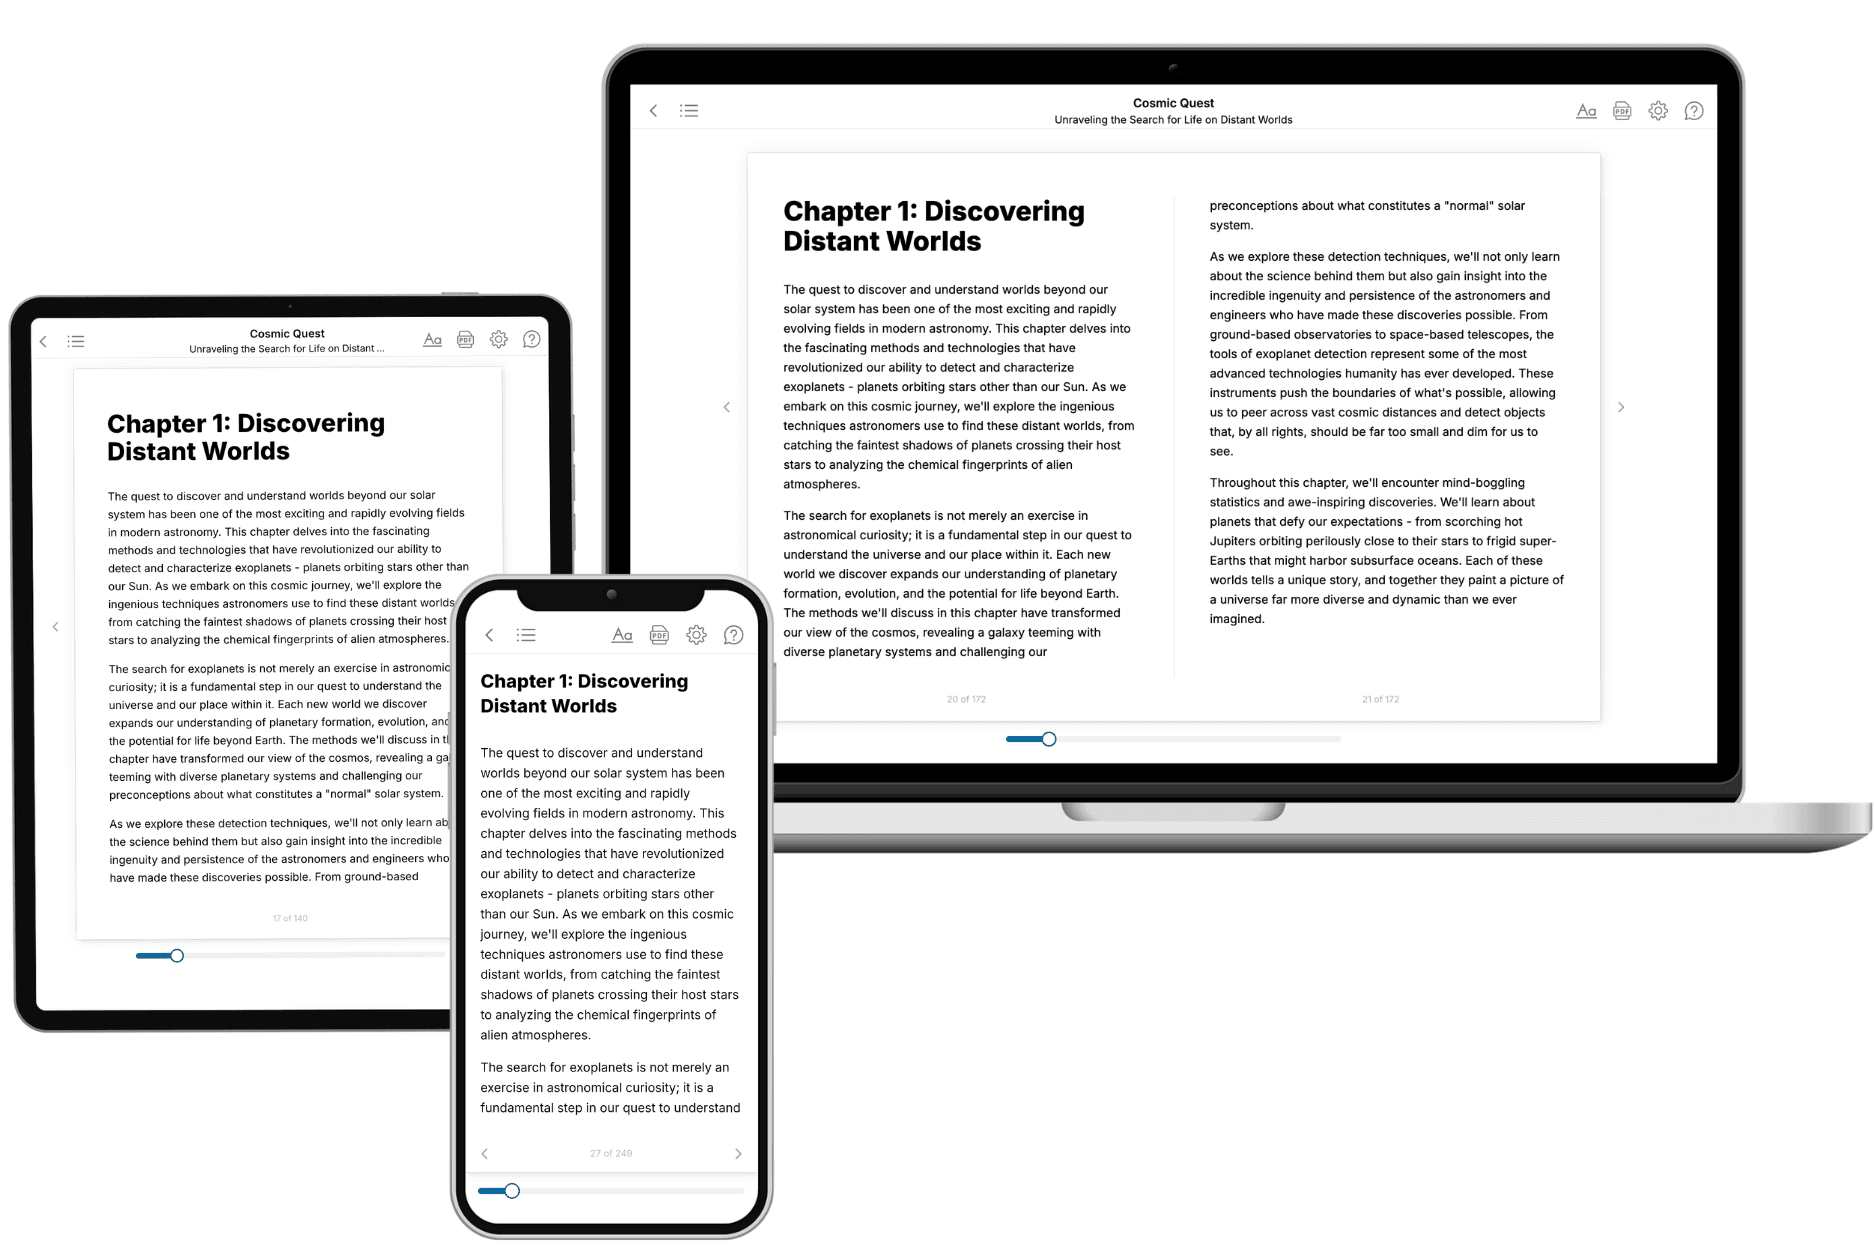
TailoredRead creates complete, full-length nonfiction ebooks, written specifically for you. Tell us what you want to learn and why, and TailoredRead writes you a complete ebook on it, with charts, tables, and diagrams throughout. Read it online, on Kindle, or on any e-reader, or download it as a PDF or EPUB. Every book is written fresh the day you order it.
- How is the book tailored to me?
Before anything is written, you answer a few short questions about your goals, your background, and the topics you care about. Your book is then planned around your answers: written at your level, focused on your goals, and covering the topics you chose, instead of the one-size-fits-all book a store sells everyone.
- Will it read like generic AI content?
No. Your book isn't a chat transcript: it's planned chapter by chapter before a single word is written, told in a clear book voice, and explains ideas visually with charts, tables, and diagrams. After writing, every book goes through an editorial pass that polishes chapters so the book reads consistent from start to finish. Judge for yourself: browse thousands of sample books on our Explore Books page.
- How accurate is the content?
Our AI first checks whether your subject needs live research. Niche and fast-moving subjects are researched before writing, and the book plan and chapters are grounded in what it finds. After writing, every book goes through a quality pass that checks its facts and consistency, and researched books list their sources in a Notes section at the back.
- How long is the book?
You choose the length: Comprehensive (250-300 pages), Detailed (150-200 pages), Essential (70-100 pages), or Short (30-50 pages).
- Does the book include visuals?
Yes. Every book includes charts, tables, and diagrams: timelines, checklists, step-by-step guides, decision trees, comparison tables, matrices, and bar charts. A typical book includes dozens of these visual elements.
- Can I read it on Kindle? What formats can I download?
Yes. Every book can be read in our online reader or downloaded as a PDF or EPUB. The EPUB can be opened with Kindle, Apple Books, Kobo, and any e-reader. The Commercial and Author licenses also include an editable Word (DOCX) and Markdown download.
- How much does it cost?
About the price of a regular ebook. The exact price depends on your book's length and complexity, from $2 for the shortest books to $35 for the most comprehensive, and it's shown when you review your book, before you commit to anything. Each book is a one-time purchase, yours to keep, no subscription. Licenses that let you share, teach, or publish your book range from $35.99 to $49.99.
- Can I preview the book before purchasing?
Before you pay, you'll see what your book will cover: the title, a detailed description, the estimated length, and the complete chapter-by-chapter table of contents, so you know what you're getting before you decide. The full text itself is written after you purchase.
- How long does it take to create a book?
About 10 minutes. You can start reading the opening chapters while the rest is still being written.