Topological Data Analysis
Understanding Shape, Structure, and Patterns in Complex Data
Most data analysis assumes your data fits neatly into standard statistical distributions.
222 pages10 chaptersJul 3, 2026Data Science
About this book
But what if the true structure of your data is fundamentally about its shape—the way points cluster, connect, and form patterns across multiple scales? Topological Data Analysis (TDA) offers a revolutionary perspective that reveals hidden geometric structures in complex datasets that traditional methods overlook. This book demystifies TDA by building from fundamental topological concepts through practical computational techniques. You'll discover how persistent homology identifies meaningful patterns, how simplicial complexes transform point clouds into analyzable structures, and how the mapper algorithm creates intuitive visualizations of data topology. Whether you're working with high-dimensional datasets, biological networks, or complex systems, TDA provides tools to uncover the intrinsic shape of your data. This guide bridges mathematical rigor with practical application, showing you not just how TDA works, but when and why to use it alongside traditional analytics.
Table of contents
- IntroductionWhy Topology Matters for Data, Limitations of Traditional Data Analysis, What Topological Data Analysis Reveals, How to Use This BookRead below
- Chapter 1: Foundations of TopologyUnderstanding Topological Spaces, Continuity and Homeomorphism, Topological Invariants and Properties
- Chapter 2: Homology and CohomologyChain Complexes and Boundary Maps, Computing Homology Groups, Cohomology and Poincaré Duality
- Chapter 3: Simplicial Complexes and Point CloudsSimplices and Simplicial Complexes, Vietoris-Rips and Čech Complexes, Alpha Complexes and Delaunay Triangulations
- Chapter 4: Persistent HomologyFiltrations and Multi-Scale Analysis, Computing Persistence and Barcodes, Interpreting Persistence Diagrams
- Chapter 5: The Mapper AlgorithmPrinciples of the Mapper Algorithm, Choosing Lens Functions and Parameters, Creating and Interpreting Mapper Graphs
- Chapter 6: Computational Methods and ToolsAlgorithms for Computing Topological Features, Software Libraries and Platforms, Computational Complexity and Scalability
- Chapter 7: Applications in Biology and MedicineProtein Structure and Molecular Analysis, Disease Classification and Patient Stratification, Genomic Data and Gene Expression
- Chapter 8: Applications in Materials Science and PhysicsMaterial Properties and Crystal Structures, Phase Transitions and Critical Phenomena, Network Analysis and Complex Systems
- Chapter 9: Machine Learning and Data Science IntegrationTDA Features for Machine Learning, Clustering and Classification with Topology, Dimensionality Reduction and Manifold Learning
- Chapter 10: Practical Workflow and Best PracticesData Preparation and Preprocessing, Parameter Selection and Validation, Interpreting Results and Communicating Findings
- ConclusionFuture Directions in Topological Data Analysis, Your Next Steps in TDA
- Glossary of Key Terms
- Further Reading and Resources
Introduction
Data is everywhere, and so is the challenge of making sense of it. Every day, scientists, engineers, and analysts work with datasets that are high-dimensional, noisy, and stubbornly resistant to simple interpretation. Traditional tools like regression, clustering, and dimensionality reduction have served us well for decades. But they all share a common assumption: that the meaningful structure in data can be captured through distances, averages, and distributions. What happens when that assumption breaks down? What happens when the most important feature of your data is not a number, but a shape?
That question is at the heart of Topological Data Analysis, or TDA. Topology is a branch of mathematics that studies the properties of shapes that remain unchanged under continuous deformation. A coffee mug and a donut are topologically identical because one can be smoothly reshaped into the other without tearing or gluing. This might sound abstract, but the core insight is powerful: some properties of a shape are more fundamental than its exact geometry. TDA takes this insight and applies it to data, asking not "what are the exact coordinates of these points?" but "what is the underlying shape of this point cloud, and what does that shape tell us?"
This book is designed to make TDA accessible without sacrificing rigor. Whether you are a data scientist looking to expand your analytical toolkit, a mathematician curious about computational applications, or a domain expert in biology, physics, or engineering who has heard about TDA and wants to understand it properly, this book meets you where you are. The chapters build progressively from foundational mathematical concepts through practical computational methods and real-world applications. By the end, you will have a clear understanding of how TDA works, when to use it, and how to integrate it with the analytical methods you already know.
One thing worth saying upfront: TDA is not a replacement for traditional data analysis. It is a complement. It excels in situations where the global structure of data matters, where patterns emerge across multiple scales, or where conventional methods produce results that feel incomplete. Think of TDA as adding a new dimension to your analytical perspective, one that lets you see the skeleton of your data rather than just its surface statistics. The goal of this book is to give you that perspective, grounded in both mathematical understanding and practical skill.
Why Topology Matters for Data
To understand why topology matters for data, start with a simple thought experiment. Imagine you have a dataset of points arranged in a circle. If you compute the mean of those points, you get the center of the circle, which is a point that belongs to none of your data. The average tells you almost nothing useful about the structure. A clustering algorithm might split the circle into two or three arcs, missing the circular pattern entirely. But topology immediately identifies the key feature: there is a loop, a one-dimensional hole, and that hole is the most important structural fact about this dataset.
This example is simple, but the principle scales to high-dimensional, complex data. In genomics, researchers have discovered that gene expression data for certain cancers lies on a topological space with specific connectivity properties that predict patient outcomes better than raw expression levels alone.[1] In neuroscience, the firing patterns of place cells in the hippocampus form a toroidal structure that reflects the animal's navigation of its environment. These are not patterns you find by computing means and variances. They are patterns you find by asking about shape.
Topology is particularly valuable because it is coordinate-free. Traditional geometric methods depend heavily on the coordinate system you choose. Rotate your data, rescale it, or embed it differently, and your distances change. Topological properties, by contrast, are invariant under these transformations. A loop is a loop whether you measure it in meters or miles, whether your axes are aligned with the data or rotated 45 degrees. This invariance makes topological features remarkably robust to the kinds of preprocessing choices that can dramatically affect other methods.
Another reason topology matters is its ability to work across multiple scales simultaneously. Most analytical methods require you to choose a scale: the bandwidth of a kernel, the number of clusters, the resolution of a histogram. TDA, through the technique of persistent homology, examines data at all scales at once and identifies which features persist across a range of scales. Features that appear and disappear quickly are likely noise. Features that persist across many scales are likely genuine structure. This multi-scale perspective is one of TDA's most distinctive and powerful contributions.
Consider a practical example from materials science. When analyzing the atomic structure of amorphous materials like metallic glasses, researchers need to distinguish between different types of local atomic arrangements. Traditional pair distribution functions capture average distances between atoms but miss the three-dimensional connectivity patterns that determine material properties. TDA-based analysis of the same data reveals loops and voids in the atomic network that correlate directly with mechanical properties like ductility and fracture resistance.[2] The shape of the data, not just its statistics, carries the scientific signal.
Topology also handles a challenge that plagues high-dimensional data: the curse of dimensionality. As the number of dimensions grows, distances between points become increasingly uniform, making distance-based methods unreliable. Topological methods are less sensitive to this problem because they focus on connectivity and relative relationships rather than absolute distances. This makes TDA especially well-suited to the kinds of high-dimensional datasets that are increasingly common in genomics, imaging, and natural language processing.
Finally, topology provides a language for describing data structure that is both mathematically precise and intuitively meaningful. Concepts like connected components, loops, and voids translate directly into data features: clusters, cyclic relationships, and enclosed regions. This correspondence between mathematical objects and interpretable data features is one of the reasons TDA has gained traction not just in mathematics but across a wide range of applied fields.
Limitations of Traditional Data Analysis
Traditional data analysis methods are powerful, but they come with assumptions that are not always stated explicitly. Understanding these assumptions helps clarify exactly where TDA adds value. The most common assumption is that data is drawn from a probability distribution that belongs to a known family, such as Gaussian, Poisson, or exponential. When this assumption holds, classical statistics provides efficient, well-understood tools. When it does not hold, those tools can produce misleading results without any obvious warning sign.
Consider k-means clustering, one of the most widely used unsupervised learning methods. K-means assumes that clusters are roughly spherical and roughly equal in size. It works by minimizing the sum of squared distances from each point to its cluster center. This works beautifully when your data actually forms spherical blobs. But when clusters are elongated, nested, or connected in non-convex ways, k-means fails systematically. It will split a single elongated cluster into multiple pieces and merge two nearby but distinct clusters into one. The algorithm is not broken; it is simply solving a different problem than the one you have.
A classic demonstration: generate two concentric rings of points in two dimensions. K-means will always split them into left and right halves, completely missing the ring structure. A topological approach immediately identifies two distinct loops, capturing the actual structure of the data.
Principal Component Analysis (PCA) is another foundational tool with important limitations. PCA finds the directions of maximum variance in data and projects the data onto those directions. It is linear, which means it can only find structure that is captured by linear combinations of features. If your data lies on a curved surface in high-dimensional space, PCA will flatten that surface in ways that distort the true relationships between points. Nonlinear dimensionality reduction methods like t-SNE and UMAP address this partially, but they introduce their own assumptions and are sensitive to parameter choices in ways that can be difficult to interpret.
Statistical hypothesis testing, the backbone of scientific inference in many fields, faces a related set of challenges. Most tests assume independence between observations, specific distributional forms, and a clear separation between signal and noise. In complex, high-dimensional datasets, these assumptions are routinely violated. Multiple testing corrections help, but they do not address the fundamental issue that the tests are designed to detect specific types of effects, not arbitrary structural patterns. A dataset could have a rich, meaningful topological structure that no standard hypothesis test would detect, simply because no one thought to test for it.
Graph-based methods and network analysis have emerged as important tools for capturing relational structure in data. Social networks, biological interaction networks, and knowledge graphs all benefit from graph-theoretic analysis. But standard graph analysis typically operates at a single scale: you either connect two nodes or you do not, based on some threshold. This binary choice is often arbitrary, and results can change dramatically depending on where you set the threshold. TDA's persistent homology approach generalizes this by tracking how the graph's topological features change as you vary the threshold continuously, giving you a complete picture rather than a snapshot.
Another limitation of traditional methods is their sensitivity to outliers and noise. Distance-based methods, in particular, can be heavily influenced by a small number of extreme points. While robust statistical methods exist, they typically work by downweighting or removing outliers rather than understanding their structural role. In some datasets, what looks like an outlier is actually a topologically significant point: a bridge between two clusters, or a point that anchors a loop. TDA provides tools to distinguish between noise and genuine structural features based on their persistence across scales.
It is also worth noting that traditional methods often struggle with heterogeneous data, where different subsets of the data have fundamentally different structures. A dataset might contain multiple distinct populations, each with its own internal organization. Standard methods that fit a single model to all the data will average over these differences, potentially missing all of them. TDA's ability to identify connected components, loops, and higher-dimensional features across the entire dataset makes it naturally suited to detecting this kind of heterogeneity.
None of this means traditional methods are bad. They are indispensable, and this book will frequently discuss how TDA works alongside them. The point is that every method has a domain where it excels and a domain where it struggles. Knowing the limitations of your tools is as important as knowing their strengths. TDA fills specific gaps that traditional methods leave open, particularly around multi-scale structure, non-linear geometry, and coordinate-free shape analysis.
What Topological Data Analysis Reveals
TDA is not a single algorithm but a collection of methods unified by the goal of extracting topological information from data. The three most important tools are persistent homology, simplicial complexes, and the mapper algorithm. Each addresses a different aspect of the problem of understanding data shape, and together they form a comprehensive toolkit for topological analysis.
Persistent homology is the central computational engine of TDA. It works by building a sequence of nested topological spaces from your data, called a filtration, and tracking how topological features appear and disappear as you move through this sequence. The features it tracks are called homological features: connected components (clusters), one-dimensional loops (cycles), two-dimensional voids (enclosed surfaces), and their higher-dimensional analogs. Each feature is characterized by the scale at which it appears (its birth) and the scale at which it disappears (its death). Features with long lifespans are considered significant; features with short lifespans are likely noise.
The output of persistent homology is typically displayed as a barcode or a persistence diagram. A barcode is a collection of horizontal bars, one for each topological feature, where the length of the bar represents the feature's lifespan. A persistence diagram plots each feature as a point in a two-dimensional plane, with birth on one axis and death on the other. Both representations make it easy to visually distinguish significant features from noise, and both can be used as input to machine learning algorithms. This translation from geometric structure to computable, comparable representations is one of TDA's most important practical contributions.
Simplicial complexes provide the bridge between raw data and topological computation. A point cloud is just a set of points; to compute its topology, you need to build a geometric structure from those points. A simplicial complex is built by connecting nearby points into edges, triangles, tetrahedra, and higher-dimensional analogs. The most common construction is the Vietoris-Rips complex, which connects any two points within a specified distance. By varying this distance parameter and tracking how the complex changes, you generate the filtration that persistent homology analyzes. The choice of complex construction affects computational cost and the types of features you can detect, and later chapters will cover these trade-offs in detail.
The mapper algorithm takes a different approach. Rather than computing homology directly, it creates a simplified graph that captures the topological structure of data in a visually interpretable form. The algorithm works by applying a lens function to the data (such as a density estimate or a principal component), dividing the range of that function into overlapping intervals, clustering the data within each interval, and connecting clusters that share data points. The result is a graph where nodes represent local clusters and edges represent overlap between clusters. This graph often reveals branching structures, loops, and flares that correspond to meaningful subpopulations or transitions in the data.
A landmark application of the mapper algorithm: researchers at Stanford used it to analyze breast cancer gene expression data and discovered a previously unknown subgroup of patients with a unique mutational profile and significantly better survival outcomes. This subgroup was invisible to standard clustering methods but appeared clearly as a distinct branch in the mapper graph.[3]
TDA also reveals structure that is genuinely multi-scale in nature. Many real-world datasets have meaningful organization at multiple levels simultaneously. A social network might have small tight-knit friend groups, medium-sized communities, and large-scale regional clusters, all present at the same time. Traditional methods force you to choose one scale of analysis. Persistent homology captures all scales at once and shows you how features at different scales relate to each other. This is not just a technical advantage; it reflects a more accurate picture of how complex systems actually work.
One of the most practically useful things TDA reveals is the presence of unexpected connectivity. In many datasets, the interesting structure is not in the clusters themselves but in how they connect. Are two populations bridged by a small number of intermediate points? Does a dataset form a single connected component or several disconnected pieces? Are there cyclic relationships where A influences B, B influences C, and C influences A? These questions are topological in nature, and TDA answers them directly. Standard methods often miss this connectivity structure entirely because they focus on local properties rather than global organization.
TDA is also increasingly being used to generate features for machine learning. Persistence diagrams and barcodes can be converted into vectors using techniques like persistence images, persistence landscapes, or kernel methods. These topological features capture information about data structure that is complementary to the features extracted by standard methods. In several benchmark studies, adding topological features to machine learning pipelines has improved classification accuracy, particularly for tasks involving shape recognition, time series analysis, and biological data.[4]
How to Use This Book
This book is organized to take you from mathematical foundations through computational methods to practical applications. The chapters build on each other, but they are also designed to be useful as standalone references once you have the foundational concepts in place. Here is a brief map of what each part of the book covers and how to navigate it based on your background and goals.
Chapters 1 and 2 cover the mathematical foundations: topological spaces, continuity, homeomorphisms, topological invariants, homology groups, and cohomology. If you have a strong mathematics background, you may move through these chapters quickly, using them primarily to establish notation and terminology. If your background is more applied, take your time here. The concepts are not as difficult as they might initially appear, and a solid grasp of them will make everything that follows much clearer. Each chapter includes concrete examples and geometric intuition alongside the formal definitions.
Chapter 3 introduces simplicial complexes and the main constructions used to build topological spaces from point cloud data. This is where the abstract mathematics starts connecting directly to data. You will learn about Vietoris-Rips complexes, Čech complexes, and alpha complexes, and understand the trade-offs between them in terms of computational cost and topological accuracy. This chapter is essential reading for anyone who wants to implement TDA methods, not just use them as black boxes.
Chapter 4 covers persistent homology in depth. This is the core computational tool of TDA, and this chapter gives you both the theoretical understanding and the practical skills to compute and interpret persistence diagrams and barcodes. By the end of this chapter, you will be able to look at a persistence diagram and extract meaningful conclusions about the structure of the underlying data.
Chapter 5 is dedicated to the mapper algorithm. Mapper is often the most immediately accessible TDA tool for practitioners because its output is a graph that can be visualized and interpreted without deep mathematical background. This chapter covers the algorithm's principles, the critical choices involved in its application (lens functions, resolution, gain), and how to interpret the resulting graphs in the context of real data.
Chapter 6 addresses the computational side of TDA: the algorithms used to compute topological features, the software libraries available (including Ripser, Gudhi, Giotto-TDA, and KeplerMapper), and the computational complexity considerations that matter when working with large datasets. This chapter is particularly important if you plan to apply TDA to real-world data at scale.
Chapters 7, 8, and 9 cover applications across three major domains:
- Biology and medicine: protein structure analysis, disease classification, patient stratification, and genomic data analysis
- Materials science and physics: crystal structure analysis, phase transitions, and complex network analysis
- Machine learning and data science: topological feature engineering, clustering, classification, and dimensionality reduction
Each application chapter is designed to be readable independently once you have the foundational chapters under your belt. If you have a specific domain interest, you can jump to the relevant chapter after completing Chapters 1 through 5.
Chapter 10 brings everything together with practical workflow guidance: how to prepare data for TDA, how to select and validate parameters, and how to interpret and communicate your findings to audiences who may not have a TDA background. This chapter is especially valuable for practitioners who need to integrate TDA into existing analytical workflows and present results to stakeholders.
Throughout the book, you will find several recurring features designed to support your learning:
- Concrete examples that illustrate abstract concepts with specific, visualizable cases
- Code references pointing to implementations in Python using standard TDA libraries
- Practical notes highlighting common pitfalls and how to avoid them
- Connections to traditional methods showing how TDA relates to tools you already know
- Application spotlights drawn from published research across multiple fields
A note on mathematical prerequisites: this book assumes familiarity with linear algebra (vectors, matrices, eigenvalues), basic calculus, and some exposure to abstract mathematics at the level of an undergraduate course in discrete mathematics or real analysis. You do not need a background in topology to start. The necessary concepts are introduced from scratch, with geometric intuition provided before formal definitions. If you encounter a term you do not recognize, the glossary at the back of the book provides concise definitions of all key terms.
Finally, a word about the spirit of this book. TDA is a young field, and it is still evolving rapidly. New algorithms, new theoretical results, and new applications appear regularly. The goal here is not to give you a complete catalog of everything TDA can do, but to give you a deep enough understanding of the core ideas that you can read new research, evaluate new tools, and adapt TDA methods to problems that have not been solved yet. The best outcome is not that you finish this book knowing TDA, but that you finish it thinking topologically, with a new way of seeing the shape of data wherever you encounter it.
Notes
Introduction
- 1. M. Nicolau and others, "Topology based data analysis identifies a subgroup of breast cancers with a unique mutational profile and excellent survival," Proceedings of the National Academy of Sciences, 2011
- 2. Y. Hiraoka and others, "Hierarchical structures of amorphous solids characterized by persistent homology," Proceedings of the National Academy of Sciences, 2016
- 3. M. Nicolau and others, "Topology based data analysis identifies a subgroup of breast cancers with a unique mutational profile and excellent survival," Proceedings of the National Academy of Sciences, 2011
- 4. F. Hensel and others, A Survey of Topological Machine Learning Methods, Frontiers in Artificial Intelligence, 2021
This is the end of the free sample. The full book has 10 chapters.
Want this book written for you?
Tell us your goals and background, and get your own version of this book, tailored by AI to you.


Benefits of AI-tailored books
- Read one book, not ten:
- all the Data Science knowledge you need, gathered into a single book.
- Save days of learning:
- tell us your goals, choose your topics, and the whole book is built around them.
- Learn effortlessly:
- Data Science book written for your specific background and expertise.
- Understand at a glance:
- includes charts, tables, timelines, checklists, decision trees, and more.
- Stay current:
- written the day you order it, not years ago.
- Trust what you read:
- every book is checked for accuracy, with real research when your subject needs it.
Create your unique book in 3 steps
- 1. Select your focus
Select the focus of your Data Science book and share your background
- 2. Personalize your book
Specify your goals and choose sub-topics to include
- 3. Get your tailored book
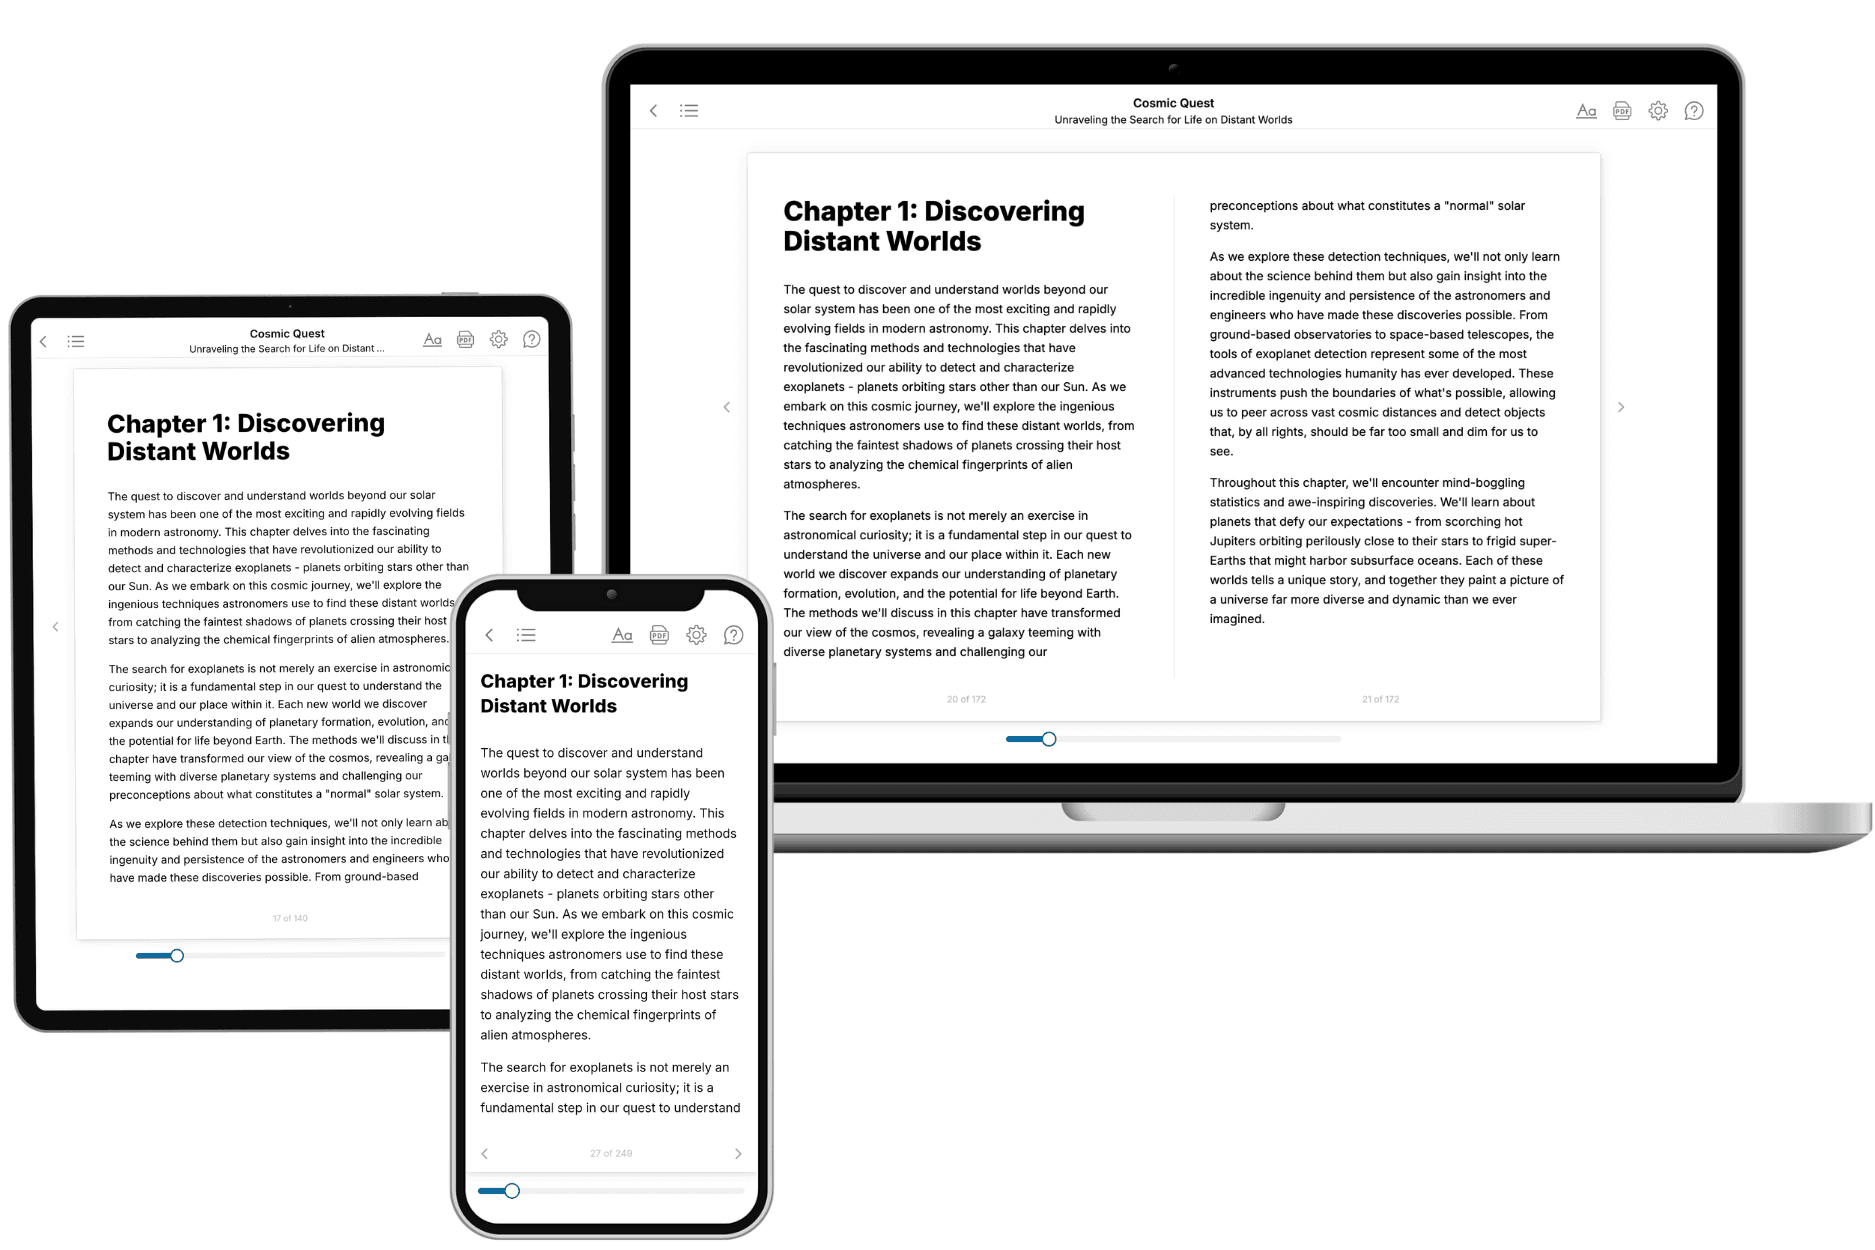
Your book is ready in 10 minutes. Read it online, download as EPUB or PDF, or send to Kindle.

Frequently asked questions
- What is TailoredRead?
TailoredRead creates complete, full-length nonfiction ebooks, written specifically for you. Tell us what you want to learn and why, and TailoredRead writes you a complete ebook on it, with charts, tables, and diagrams throughout. Read it online, on Kindle, or on any e-reader, or download it as a PDF or EPUB. Every book is written fresh the day you order it.
- How is the book tailored to me?
Before anything is written, you answer a few short questions about your goals, your background, and the topics you care about. Your book is then planned around your answers: written at your level, focused on your goals, and covering the topics you chose, instead of the one-size-fits-all book a store sells everyone.
- Will it read like generic AI content?
No. Your book isn't a chat transcript: it's planned chapter by chapter before a single word is written, told in a clear book voice, and explains ideas visually with charts, tables, and diagrams. After writing, every book goes through an editorial pass that polishes chapters so the book reads consistent from start to finish. Judge for yourself: browse thousands of sample books on our Explore Books page.
- How accurate is the content?
Our AI first checks whether your subject needs live research. Niche and fast-moving subjects are researched before writing, and the book plan and chapters are grounded in what it finds. After writing, every book goes through a quality pass that checks its facts and consistency, and researched books list their sources in a Notes section at the back.
- How long is the book?
You choose the length: Comprehensive (250-300 pages), Detailed (150-200 pages), Essential (70-100 pages), or Short (30-50 pages).
- Does the book include visuals?
Yes. Every book includes charts, tables, and diagrams: timelines, checklists, step-by-step guides, decision trees, comparison tables, matrices, and bar charts. A typical book includes dozens of these visual elements.
- Can I read it on Kindle? What formats can I download?
Yes. Every book can be read in our online reader or downloaded as a PDF or EPUB. The EPUB can be opened with Kindle, Apple Books, Kobo, and any e-reader. The Commercial and Author licenses also include an editable Word (DOCX) and Markdown download.
- How much does it cost?
About the price of a regular ebook. The exact price depends on your book's length and complexity, from $2 for the shortest books to $35 for the most comprehensive, and it's shown when you review your book, before you commit to anything. Each book is a one-time purchase, yours to keep, no subscription. Licenses that let you share, teach, or publish your book range from $35.99 to $49.99.
- Can I preview the book before purchasing?
Before you pay, you'll see what your book will cover: the title, a detailed description, the estimated length, and the complete chapter-by-chapter table of contents, so you know what you're getting before you decide. The full text itself is written after you purchase.
- How long does it take to create a book?
About 10 minutes. You can start reading the opening chapters while the rest is still being written.